Download

1 / 24
240 likes | 317 Views
Explore the climatology, wind patterns, and cyclone evolution affecting storm surges in New York City, with emphasis on historical events and future projections. Investigate relationships between wind speed, cyclone tracks, and surge events. Analyze the impact of sea-level rise on flood events, using observational data and meteorological analysis techniques.

E N D
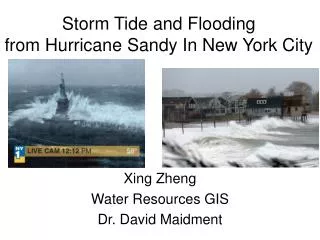
New York City Storm Surges: Climatology and An Analysis of the Wind and Cyclone Evolution Dr. Brian A. Colle, Katherine Rojowsky, and F. Bounaiuto School of Marine and Atmospheric Sciences Stony Brook University, SUNY
Lidar image of business district of Manhattan showing elevation and seawall locations (arrows). The imager is flying above the Hudson River looking east. (Photo Courtesy: NOAA/U.S/ Army JPSD)
3 September 1821: Only Major hurricane to hit NYC directly (category 3) NYC area tracks obtained by observations and geological survey (Scileppi and Donnelly 2007) The 1821 hurricane produced a storm surge of 13 feet (4 m) in only one hour at Battery Park. Manhattan Island was completely flooded to Canal Street;
Tropical Storm Tracks: 1851-2005 Figure provided by J. I. Virmani, 2007
December 1992 Nor-easter NARR Analysis ADCIRC model hindcast of water level ASL (m) using MM5 winds and pressures at 18 UTC 12 Dec (Colle et al. 2008) (18Z 12 Dec 1992) * L (6Z 13 Dec 1992) * L
12-13 December 1992 Nor-easter FDR Drive during the December 1992 nor’easter (Bloomfield, 1999) Source: Metro New York Hurricane Transportation Study, 1995 Ref: Bloomfield, J., M. Smith and N. Thompson, 1999. Hot Nights in the City. Environmental Defense Fund, New York.
Motivational Questions • What is the variability of minor and moderate storm surges and flooding events at NYC during the past 50 years? • How will the number of moderate flooding events change as sea level rises during the next 50-100 years? • How does the wind speed and direction evolve around NYC for minor and moderate surge events? • What are the cyclone tracks and position at maximum surge that favor storm surge events for the NYC area?
Climatological Analysis of NYC Surges A minor and moderate surge at the Battery that would result in a coastal flood advisory and warning, respectively, by the NWS during a high tide (mean high water). Minor: 0.60-1.00 m above MHW Moderate: >1.00 m above MHW Donna (’60) (Gloria ‘85) (’92 Nor-easter) Maximum daily surge at the Battery, NYC (1959 -2007) 1960s 1970s 1980s 1990s 2000s
Number of Minor and Moderate Surge Events Minor Surge Moderate Surge
Monthly MinorSurge Events at the Battery, NY ‘59-‘07 Monthly ModerateSurge Events at the Battery, NY ‘59-‘07
’82-‘83 ’72-‘73 ’97-’98 Minor Surge Events at the Battery, NY ‘59-‘07 5 yr running mean
Moderate observed water level flooding events absent after 1996 Monthly MinorSurge Events at the Battery, NY ‘59-‘07 Annual Moderate Surge Events at the Battery, NY ‘59-‘07 Annual Observed Moderate Flooding Events at the Battery, NY ‘59-‘07 *Surge + tidal = total water level (storm tide) NWS threshold Mod. Flooding = 2.44m above Mean Low-Low Water (MLLW)
Impact of Sea-Level Rise on NYC Flood Events IPCC (2007) 12-50 cm over next 50-100 yrs) After 12.5 cm Sea-Level Rise Observed Moderate Flooding Events
Impact of Sea-Level Rise on NYC Flood Events IPCC (2007), 12-50 cm over next 50-100 yrs) After 25 cm Sea-Level Rise After 50 cm Sea-Level Rise
Impact of Sea-Level Rise on Minor Flood Events (rise ~2.77 mm/yr at Battery--10-15 cm over 50 yrs) Observed Minor Flooding Events After Sea-Level Rise Correction NWS threshold = 2.04 (minor flooding – coastal flood advisory), 2.44 (moderate flooding) above Mean Low-Low Water (MLLW)
Meteorological Analysis • Datasets: -- Hourly 10-m wind observations from Bennett’s Field (1968-1971) and JFK airport (1973-2007). -- NCAR-NCEP global (2 degree) reanalysis (1959-1978) Regional reanalysis (1979-2006) • Approach: -- For 191 minor and 31 moderate events after 1968, quantified the average wind evolution at JFK and Bennett’s Field from 48-h before time of maximum surge to 24-h afterwards. -- Manually tracked cyclones within reanalysis for surge events 0.8-1.0 and > 1.0 (2mb closed contour for cyclone closest to NYC).
Wind Direction Evolution at JFK/Bennetts Wind Direction -48/+24h Surrounding Maximum Surge Speed & Direction Frequency at Time of Maximum Surge Minor Speed (m/s) Minor Moderate Time of max surge
Wind Speed Evolution at JFK Wind Speed -48/+24h Surrounding Maximum Surge Distribution of Wind Speeds at Maximum Surge Time of max surge
Number of Cyclone Centers 9 6 5 4 3 2 1 Minor Surge Cyclone Tracks -48/+12h Cyclone Tracks Position at Time of Max Surge 0.8-1.0 m events 0.6-1.0 m events *
Number of Cyclone Centers 9 6 5 4 3 2 1 Moderate Surge Cyclone Tracks -48/+12h Cyclone Tracks Position at Time of Max Surge 1.0 m events 1.0 m events *
NCEP Reanalysis SLP Composite of 46 > 1-m Surges at Battery, NY -36 h -24 h -24h H H H L L -12 h 0 h H H L L
NCEP Reanalysis 500Z Composite of 46 > 1-m Surges at Battery, NY -36 h -24 h -12 h 0 h
Conclusions • Large inter-annual & inter-decadal variability. Minor surge events more prevalent during the 60’s, 70’s & mid-90’s. Only 1 moderate surface event since 2000 and no observed moderate flooding events since 1996. • A 10-15 cm sea-level rise over last 50 years has increased the number of minor flood events (given coastal flood advisory threshold by NWS). • Flooding (even for nor-easters) will increase dramatically as sea level rises 10-50 cm over the next 50-100 years. • Moderate event mean wind speeds 25% greater at the time of maximum surge than minor events. Wind speeds in isolation not a good predictor of minor vs. mod surge. • Diverse tracks for minor & moderate, with moderate tending toward the coast (Miller Type A track).