CSI 2005 Computer Crime Survey
320 likes | 594 Views
CSI 2005 Computer Crime Survey. Put together by J. Scott, 2006 Using Graphics and Text from the Published CSI/FBI 2005 Crime Survey. Eleven Key Findings for the 2005 Survey.

CSI 2005 Computer Crime Survey
E N D
Presentation Transcript
CSI 2005Computer Crime Survey Put together by J. Scott, 2006 Using Graphics and Text from the Published CSI/FBI 2005 Crime Survey
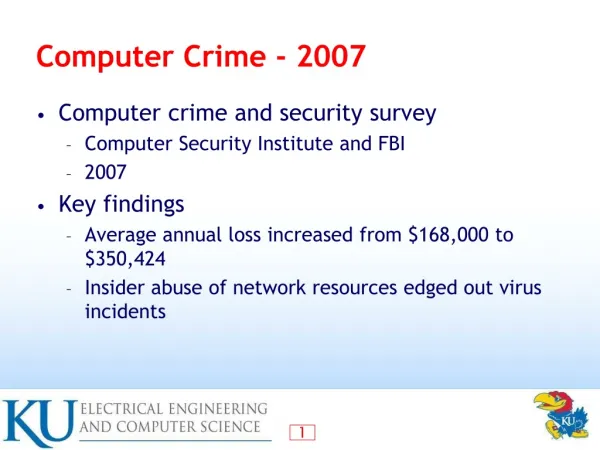
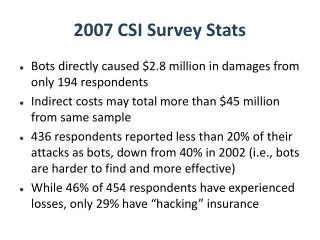
Eleven Key Findings for the 2005 Survey General Note: the number of responses increased dramatically in the 2005 survey, going from 494 responses in 2004 to 700 responses in 2005, even though the sample size remained the same. This was likely due in some measure to an increase in the number of reminders sent to the sample group. ❏Virus attacks continue as the source of the greatest financial losses. Unauthorized access, however, showed a dramatic cost increase and replaced denial of service as the second most significant contributor to computer crime losses during the past year. J. Scott 2006
Eleven Findings for the 2005 Survey - 2 ❏ Unauthorized use of computer systems has increased slightly according to the respondents, but the total dollar amount of financial losses resulting from cyber crime is decreasing. Since the total number of respondents has dramatically increased, this implies a dramatic decrease in average total losses per respondent. Two specific areas (unauthorized access to information and theft of proprietary information) did show significant increases in average loss per respondent. ❏ Web site incidents have increased dramatically. ❏ State governments currently have both the largest information security operating expense and investment per employee of all industry/government segments. J. Scott 2006
Eleven Findings for the 2005 Survey - 3 ❏Despite talk of increasing outsourcing, the survey results related to outsourcing are nearly identical to those reported last year and indicate very little outsourcing of information security activities. Among those organizations that do outsource some computer security activities, the percentage of activities outsourced is quite low. ❏ Use of cyber insurance remains low (i.e., cyber security insurance is not catching on despite the numerous articles that now discuss the emerging role of cyber security insurance). ❏ The percentage of organizations reporting computer intrusions to law enforcement has continued its multi-year decline. The key reason cited for not reporting intrusions to law enforcement is the concern for negative publicity. J. Scott 2006
Eleven Findings for the 2005 Survey - 4 ❏ A significant number of organizations conduct some form of economic evaluation of their security expenditures, with 38 percent using Return on Investment (ROI), 19 percent using Internal Rate of Return (IRR) and 18 percent using Net Present Value (NPV). ❏ Over 87 percent of the organizations conduct security audits, up from 82 percent in last year’s survey. ❏ The Sarbanes-Oxley Act has begun to have an impact on information security in more industry sectors than last year. ❏ The vast majority of respondents view security awareness training as important. However, (on average) respondents from all sectors do not believe their organization invests enough in it. J. Scott 2006
Survey Respondents by Industry J. Scott 2006
Respondents by Number of Employees J. Scott 2006
Survey Respondents by Revenue J. Scott 2006
Survey Respondents by Job Description J. Scott 2006
Percentage of IT Budget on Security J. Scott 2006
Computer Security Expenses / Employee J. Scott 2006
Computer Security Expenditure / Employee J. Scott 2006
Average Security Investment / Employee J. Scott 2006
Organizations using Metrics J. Scott 2006
Percentage Of Security Function Outsourced J. Scott 2006
Average Percent of Security Outsourced J. Scott 2006
External Insurance Against Risks J. Scott 2006
Unauthorized Use in Last 12 Months J. Scott 2006
Survey J. Scott 2006
Web Site Percentage Security Incidents J. Scott 2006
Security Technologies Used J. Scott 2006
Organizations Conduction Security Audits J. Scott 2006
Invest Appropriately on Security Awareness J. Scott 2006
Importance of Security Awareness Training J. Scott 2006
After Intrusion, What Actions Taken J. Scott 2006
Why Not Report to Law Enforcement? J. Scott 2006
Percent of Organizations Sharing Information J. Scott 2006
Survey J. Scott 2006