Download
1 / 63
630 likes | 951 Views
Monitoring teacher implementation of specially designed instruction and services. Specially designed instruction. Defined in IDEA 2004 as adapting the content, methodology, and delivery of instruction Specially designed instruction vs. good teaching.

E N D
Monitoring teacher implementation of specially designed instruction and services
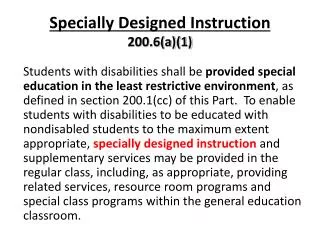
Specially designed instruction • Defined in IDEA 2004 as adapting the content, methodology, and delivery of instruction • Specially designed instruction vs. good teaching
Individualized accommodations for accessing grade level content • Multiple means of representation • Changes in the way information is presented • Multiple means of expression • Providing alternate ways for students to demonstrate what they know • Multiple means of engagement • Changes to gain student’s interest and increase motivation • Curriculum adaptations • Changes in representation of content
Specially designed instruction • Intensive and individualized • Research based practices for students with disabilities • Direct Instruction • Reading • Math • Social Skills for BIC classes • Learning Strategy instruction • Explicit and intensive instruction on IEP goals and objectives
Direct instruction • Research based • Adams & Carnine (2004) conducted meta-analysis • Findings clearly support effectiveness of this strategy. • Reading • Examples include Project Read, Reading Mastery Plus, Corrective Reading, Read Naturally, Don Johnston • Math • Examples include Mountain Math, Touch Math, Basic Math, etc.
Learning Strategy instruction • Research based • Focus on teaching students how to learn • Focusing together • Framing Routine • SLANT • Proficiency Sentence Writing • LINCS • Error Monitoring Strategy • Concept Mastery Routine • Content Enhancement Routines l
IEP instruction • Direct and intensive • Deficit skills identified in student’s IEP goals and objectives
Controlling task difficulty • Increase student motivation • Avoid frustration
Grouping strategies • Small interactive groups • Peer tutoring • Cooperative learning Note: whole group instruction is not appropriate in resource or self-contained settings.
Behavior management strategies Strategies on the (BIP): • Antecedent strategies (prior to behavior occurring) • Consequence strategies (strategies used after the behavior occurs) • Teaching replacement behaviors (see handout) For BIC classrooms – • Individual student point sheets linked to class wide motivation system
Classroom environment components • Posted daily schedules • Learning centers/stations • Staff schedule posted • Beginning and ending routines • Attention signal • Posted classroom expectations • Additional components for BIC classes: • Crisis management plan
Progress monitoring • Is the teacher collecting and analyzing data on IEP goals and objectives or curriculum based measurements? • Is the teacher using data to drive instructional decisions?
What is Progress Monitoring? Progress monitoring is the on-going process of collecting and analyzing data to determine student progress.
What is Progress Monitoring? Progress monitoring should be used to: • Make instructional and service decisions based on student performance. • Determine progress on IEPs (annual goals and objectives) for students in special education.
RationaleWhy Use Progress Monitoring? Individuals With Disabilities Education Improvement Act (IDEA) 2004 • Requires a student’s individualized education plan (IEP) to include: • A statement of present levels of academic and functional performance; • A statement of measurable annual goals; • A statement of special education, related and supplemental services; • An explanation of the extent, if any, of non-participation in the regular classroom; Etscheidt, Susan K. (2006)
Why Use Progress Monitoring? • A statement of any appropriate and necessary accommodations on state and district-wide assessments; • A statement of dates and duration of services; • Appropriate, measurable post-secondary goals and transition services; and • A statement of how the child’s progress toward the annual goals will be measured. Etscheidt, Susan K. (2006)
Why Use Progress Monitoring? Legal Decisions • The absence of adequate progress monitoring has been the focus of several administrative and judicial decisions. • Courts are unwilling to accept the claims of school districts regarding the appropriateness of a student’s program without proof in the form of data. Etscheidt, Susan K. (2006)
Why Use Progress Monitoring? Recent decisions have revealed five primary areas of concern: • The IEP team fails to develop or implement progress monitoring plans; • Responsibilities for progress monitoring are improperly delegated; Etscheidt, Susan K. (2006)
Why Use Progress Monitoring? • The IEP team does not plan or implement progress monitoring for behavior intervention plans; • The team uses inappropriate measures to determine student progress toward graduation; • Progress monitoring is not frequent enough to meet the requirements of IDEA or to provide meaningful data to IEP teams. Etscheidt, Susan K. (2006)
Step 1: Write Measurable Goals and Objectives The PLAFP sets the baseline for the annual goals. • Determines approaches for ensuring involvement in, or adaptations or modifications to, the general education curriculum. • Should accurately describe the student’s performance in all areas of education that are affected by the student’s disability. • Each area of educational need identified in the PLAFP must be addressed in at least one other section of the form: annual goals, supplementary aids/services, special education programs and services, and/or secondary transition services.
Work samples School records Checklists Career, transition, vocational assessments Student work samples, portfolios Teacher observations and records Parent input Student Interviews Behavioral data CBAs and CBMS Systematic data collection Report Cards Statewide assessment Benchmark assessment Teacher-made tests Norm-referenced tests Criterion Referenced Tests (CLASS) PLAFP Information Sources Step 1: Write Measurable Goals and Objectives
Step 1: Write Measurable Goals and Objectives PLAFP Example Charlie knows how to compute math problems, but is unable to meet the 5th grade standards (80% on math benchmarks) for understanding and applying problem solving strategies to story problems. He does not understand the relationship between a description and a mathematical solution. Charlie scored at the 2.8 level on the solving section of the Key Math test, and 4.8 on the Computation section. He completes word problems with 50% accuracy.
Step 1: Write Measurable Goals and Objectives PLAFP Example: Joshua is a 10 year old student in third grade who needs clearly defined rules and a structured environment. In unstructured situations or when given a difficult assignment, Joshua will often hit teachers and peers. His hitting behavior occurs an average of 6 times per day. During preferred activities, Joshua engages in appropriate peer interactions on a daily basis.
Step 1: Write Measurable Goals and Objectives • Precise and measurable goals provide a clear basis for monitoring student progress. • The annual goals estimate what outcomes can be expected in an academic year based on the student’s present level of performance. • The objectives provide steps for meeting the goal.
Step 1: Write Measurable Goals and Objectives • It is important to consider how the cumulative effect of special education services will help achieve school and post-school outcomes when setting the annual goals. • Even though the IEP focuses on goals for one year, the goals should be building toward helping the student achieve post-school or long-term outcomes.
Step 1: Write Measurable Goals and Objectives Annual goals and short-term objectives must have the following components: • Student: Use the student’s name. • Behavior: State what the student will do. Use verbs that are observable and measurable. • Conditions: State the specific circumstances under which the student will perform the expected behaviors. • Criterion: Set a standard indicates a reasonable level of performance that the student will achieve after instruction or intervention.
Step 1: Write Measurable Goals and Objectives Table Activity: Use the Reference Guide to write a measurable goal and/or objective for Joshua.
Step 2: Making Data Collection Decisions Data decisions guide the selection of a meaningful data collection tool • Type of data needed • Where • By Whom • How often -
Step 2: Make Data Collection Decisions What type of data will be collected? • Permanent/Visible products • Event Recording • Duration Recording • ABC Charts • Anecdotal Observations
Step 2: Make Data Collection Decisions Where will data be collected? • Classroom • Playground • Cafeteria • School Hallways • Job-site • Community Anywhere data reflecting progress can be observed and counted efficiently!
Step 2: Making Data Collection Decisions Who will collect data? General Education teacher Special Education teacher Paraprofessional Student Job coach Parent Others
Step 2: Make Data Collection Decisions How often will data be collected? • Daily • Monthly • Weekly • Quarterly Data must be gathered as frequently as necessary—and no more!
Step 2: Make Data Collection Decisions Effectiveness of services and instructional method is best determined when progress is measured frequently. An Administrator’s Guide to Measuring Achievement for Students with IEPs. http://www.awa11.k12.ia.us/iep/iepresults/AdministratorsGuide.htm
Step 3: Determine Data Collection Tools/Schedules • The tools used to collect data and measure progress provide evidence of student performance specific to IEP goals and objectives. • Data collection tools should represent different types of measurement in order to provide a clear picture of student progress.
Step 3: Determine Data Collection Tools/Schedules • Structured interviews • Teacher-made tests • Surveys • Rating scales • Rubrics • Curriculum-based assessment • Observations • CBMS • Work Samples • Assessment checklists • Anecdotal records • Portfolio assessment Commonly used tools/methods:
Step 3: Determine Data Collection Tools/Schedules The data collection schedule depends on how service is delivered: • Times for data collection should be worked into daily and weekly plans for instruction. • Data collection does not necessarily have to be separate from instructional time. • Regular education teachers and other service providers play a key role in data collection and input. • Times for data collection should be scheduled when concerns have been brought up.
Step 3: Determine Data Collection Tools/Schedules • Think-Pair-Share • 1)Think for a few moments about how you would collect data on Joshua’s behavior. • 2)Pair with a partner and talk about the answer each of you came up with. Identify the answers you think are best or most unique. • 3)Share your thinking with the whole group.
Step 3: Determine Data Collection Tools/Schedules • Visual representation of data provides a picture of student progress, and helps to clarify the written word or list of numbers used to make decisions. • Ways to show data visually include: Graphs Charts Checklists
Baseline data Joshua’s hitting behavior • Time M T W T F Total • 9-9:10 / / / / 4 • 9:30-40 / / // / / 6 • 10-10:10 // /// / // / 9 • 10:30-40 /// / //// /// // 13 • Day total 7 6 7 7 5
Step 3: Determine Data Collection Tools/Schedules Table Activity Use the information to graph the baseline data. Share with others at your table.
Joshua baseline data Frequency of hitting behavior Baseline Intervention
Joshua baseline data Frequency of hitting behavior Baseline Intervention
Step 4: Represent the Data Visually Compiling data is a critical component. • Periodically review and graph or chart the collected data. • Attempting to compile all data collected during the year right before the ARD would be an overwhelming task.
After Intervention Data Joshua’s hitting behavior Time M T W T F M Total 9-9:10 / // // // / / 9 9:30-40 / / / / 4 10-10:10 / // / // / / 8 10:30-40 // //// // / // // 13 Day total 4 9 6 6 5 4
Step 4: Represent the Data Visually Table Activity: • Graph data • Discuss the impact of the graphs. • How might the IEP meetings for these students gone had only the collected data (not compiled) been shared.