Download

1 / 33
0 likes | 5 Views
The 2012 Survey of the Performance of American Elections conducted by Charles Stewart III from MIT provides insights into the voting experience, including ease of voting, wait times, performance of polling places and workers, and voter confidence in the election process. Key findings include positive experiences on Election Day, early voting, and absentee voting, along with trends in voter identification, lines at polling places, and partisan divisions on election administration.

E N D
2012 Survey of the Performance of American Elections* DE Charles Stewart III MIT *A first look
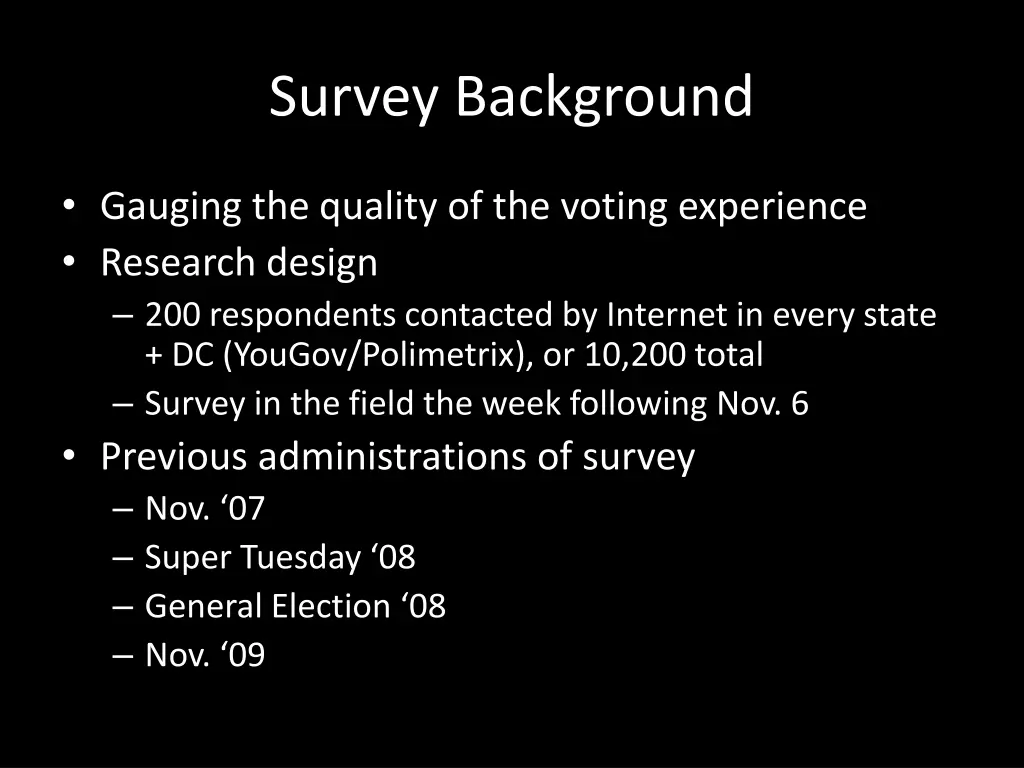
Survey Background • Gauging the quality of the voting experience • Research design – 200 respondents contacted by Internet in every state + DC (YouGov/Polimetrix), or 10,200 total – Survey in the field the week following Nov. 6 • Previous administrations of survey – Nov. ‘07 – Super Tuesday ‘08 – General Election ‘08 – Nov. ‘09
Overall, the experience of voters on Election Day was positive • 86% said it was “very easy” to find their polling place • 3% said they encountered a registration problem when they went to vote • 13 min = avg. wait time to vote – 63% said most of this time was waiting to check in • 2% said they encountered voting equipment problems • 78% said their polling place was run “very well” • 65% said the performance of polls workers was “excellent” • 67% said they were “very confident” that their vote was counted as cast

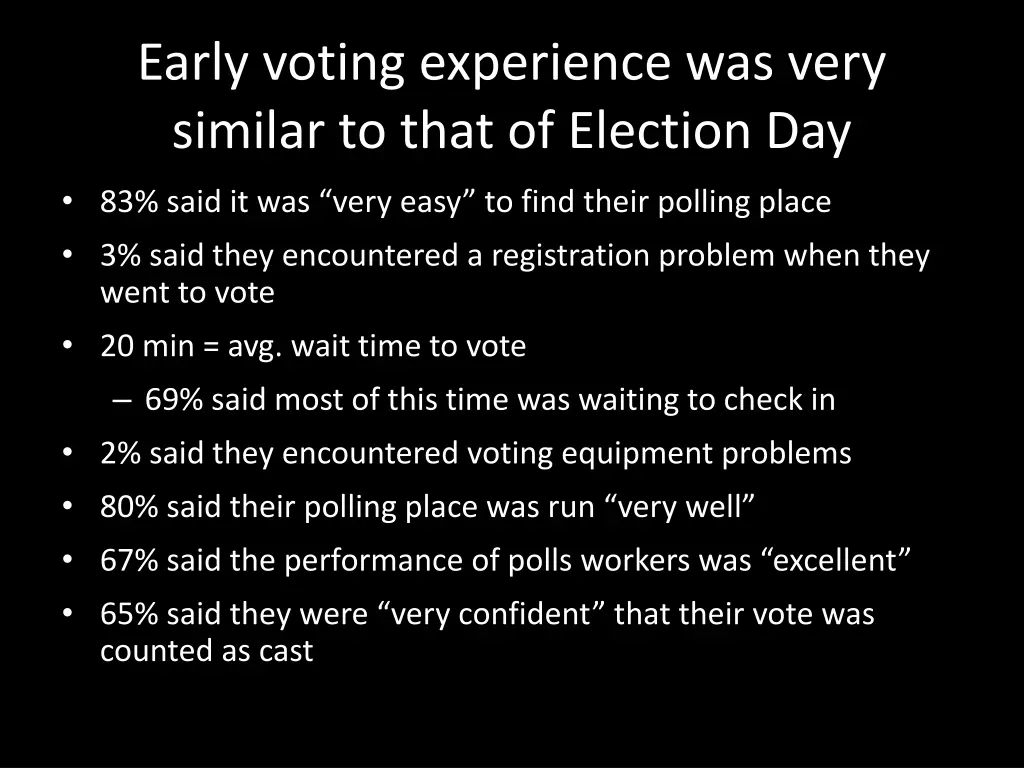
Early voting experience was very similar to that of Election Day • 83% said it was “very easy” to find their polling place • 3% said they encountered a registration problem when they went to vote • 20 min = avg. wait time to vote – 69% said most of this time was waiting to check in • 2% said they encountered voting equipment problems • 80% said their polling place was run “very well” • 67% said the performance of polls workers was “excellent” • 65% said they were “very confident” that their vote was counted as cast
Absentee voters also satisfied • 2% said they encountered problems receiving their mail ballot • <1% said they encountered problems marking their mail ballot • 83% said they found the instructions easy to follow in marking their ballot • 56% said they were “very confident” that their vote was counted as cast • Of those who reported not voting, 18% reported requesting, but not receiving, an absentee ballot.

• Voter identification • Lines • Partisan divisions
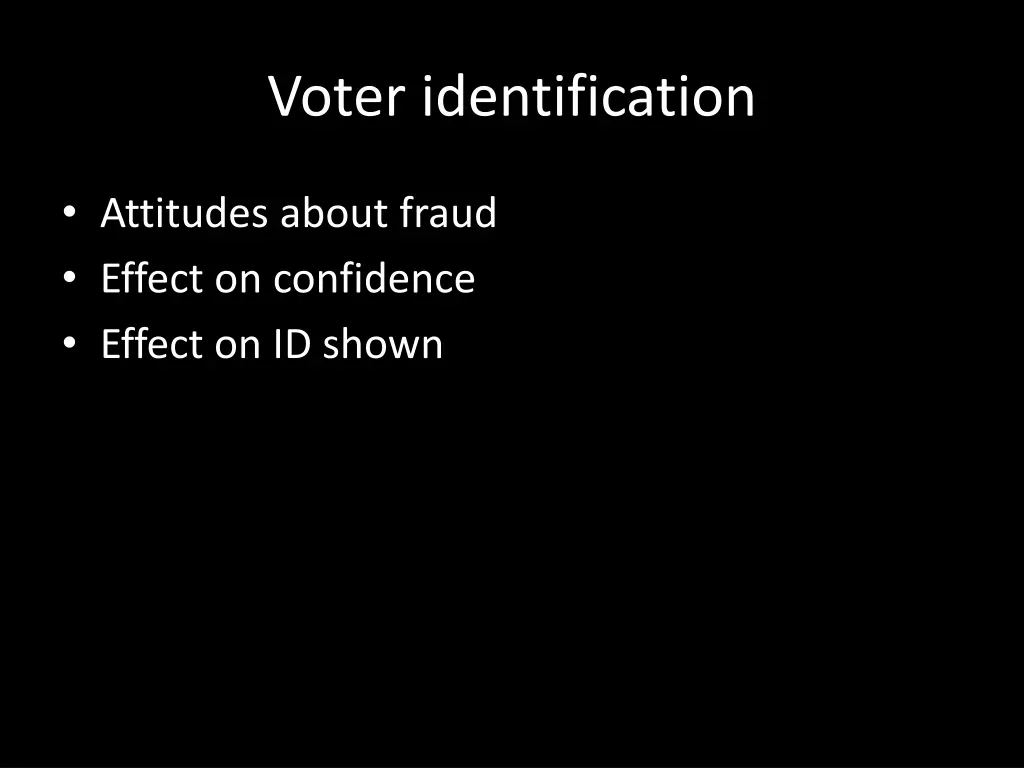
Voter identification • Attitudes about fraud • Effect on confidence • Effect on ID shown
69% of respondents favor requiring all voters to show photo ID when they vote.

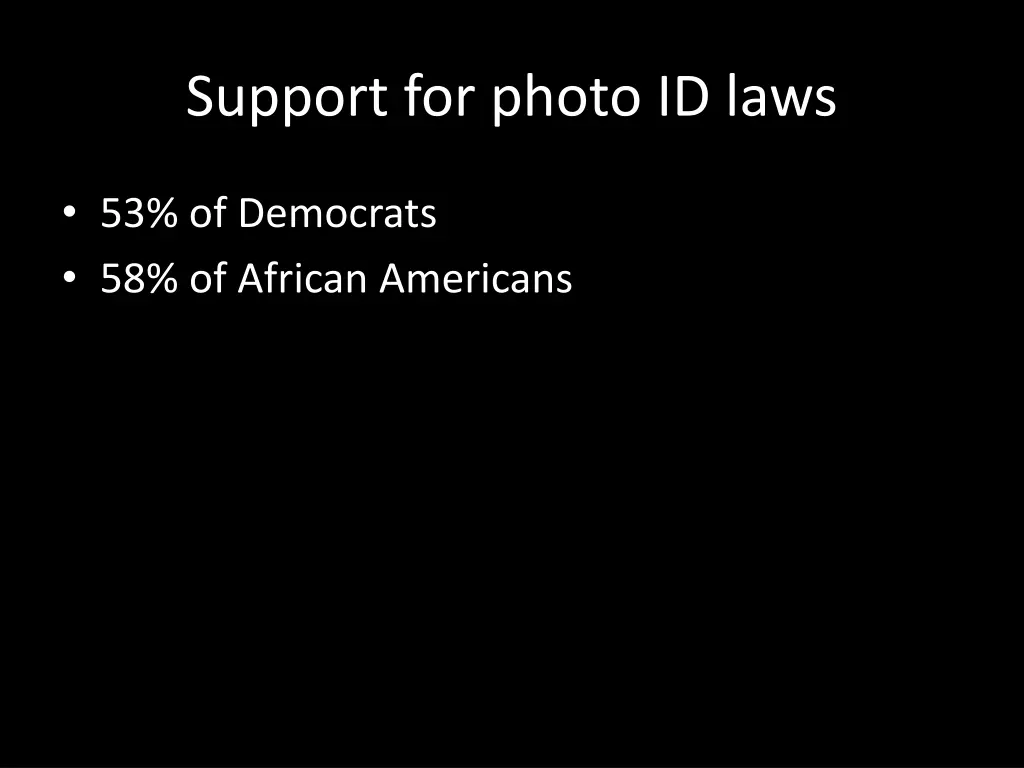
Support for photo ID laws • 53% of Democrats • 58% of African Americans
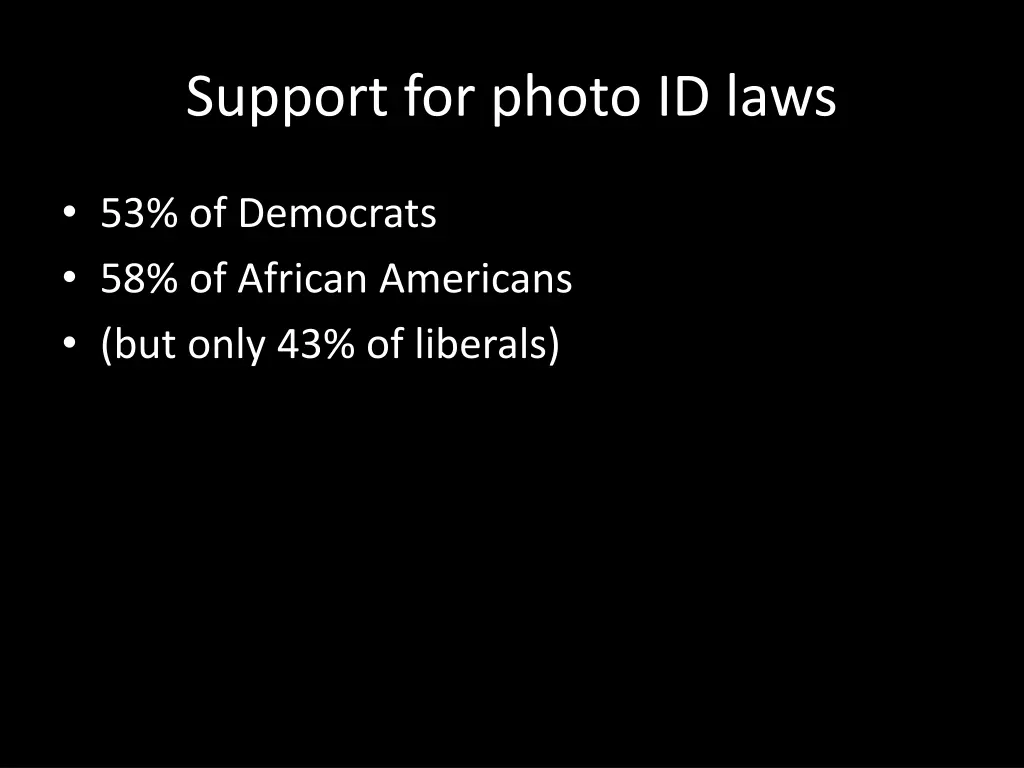
Support for photo ID laws • 53% of Democrats • 58% of African Americans • (but only 43% of liberals)
It is very common in my city or county… States w/ photo ID laws All other states Diff. People pretending to be others 11% 11% 0

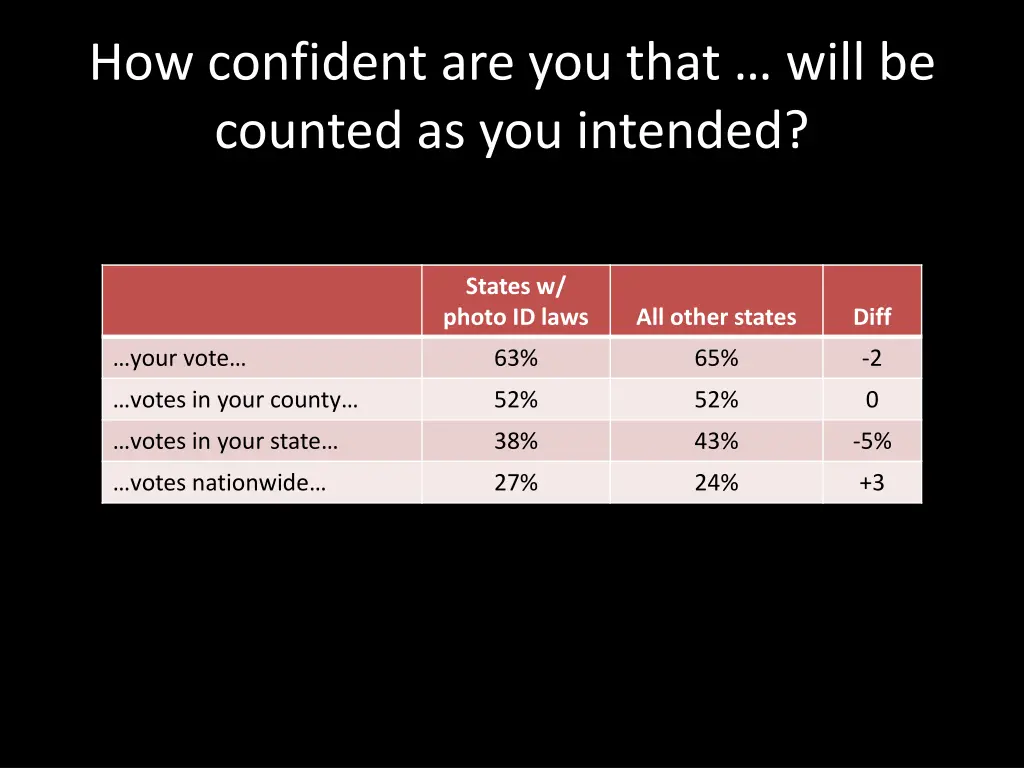
How confident are you that … will be counted as you intended? States w/ photo ID laws All other states Diff …your vote… 63% 65% -2 …votes in your county… 52% 52% 0 …votes in your state… 38% 43% -5% …votes nationwide… 27% 24% +3
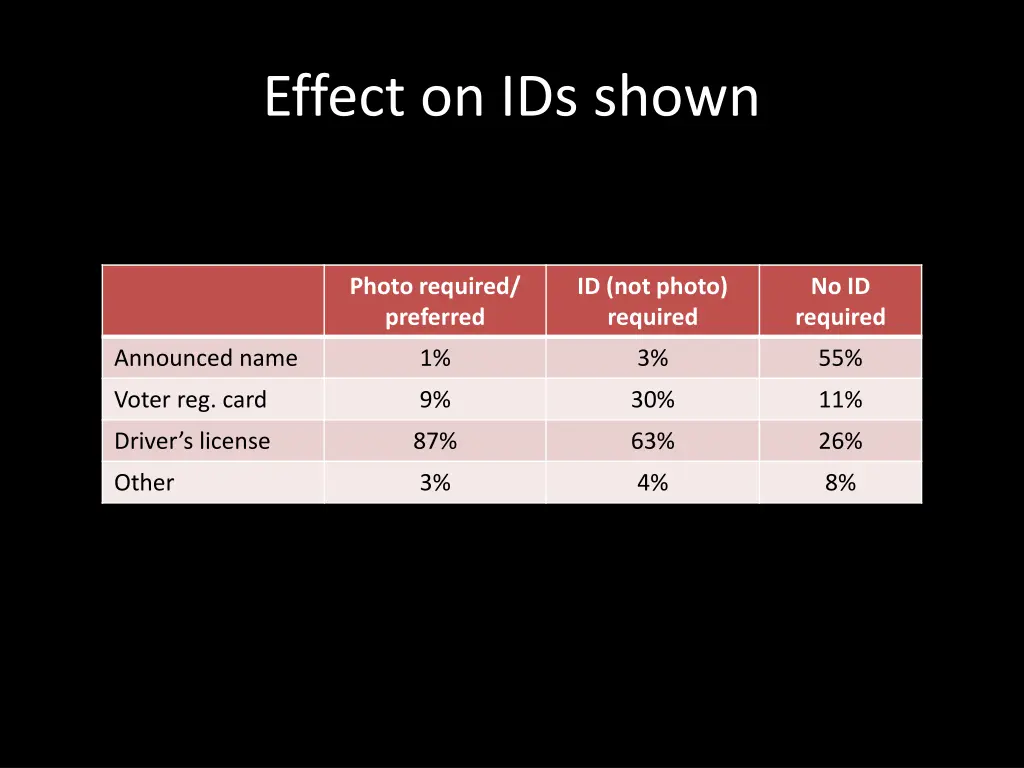
Effect on IDs shown Photo required/ preferred ID (not photo) required No ID required Announced name 1% 3% 55% Voter reg. card 9% 30% 11% Driver’s license 87% 63% 26% Other 3% 4% 8%
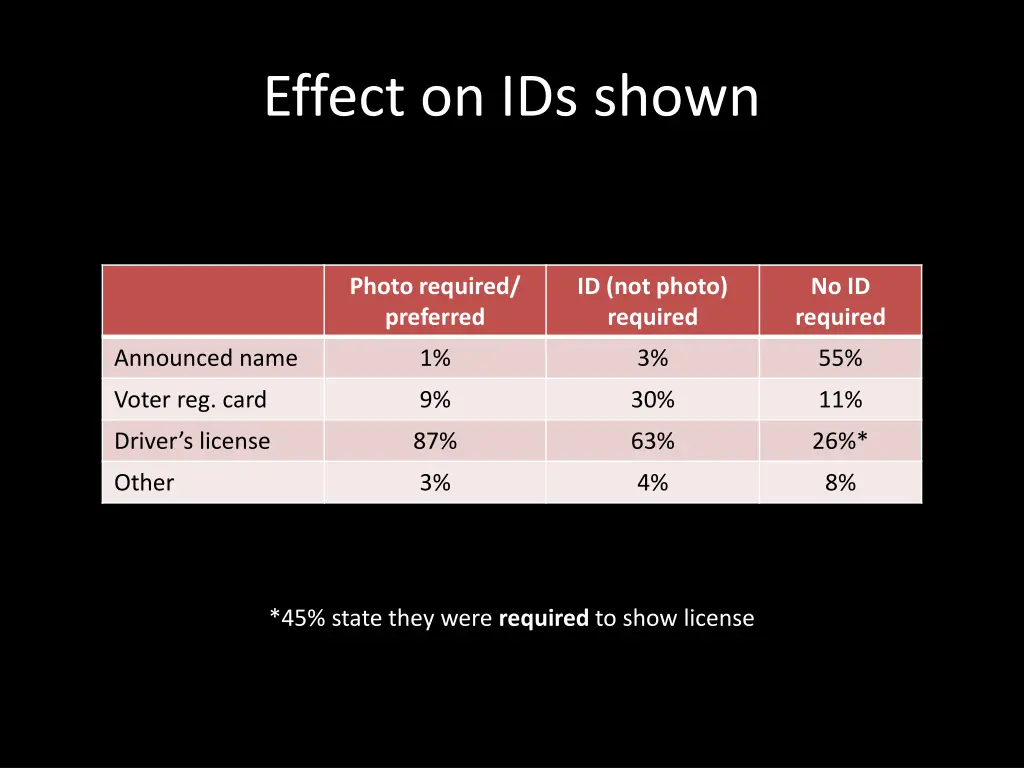
Effect on IDs shown Photo required/ preferred ID (not photo) required No ID required Announced name 1% 3% 55% Voter reg. card 9% 30% 11% Driver’s license 87% 63% 26%* Other 3% 4% 8% *45% state they were required to show license
Lines an issue in 2012 election
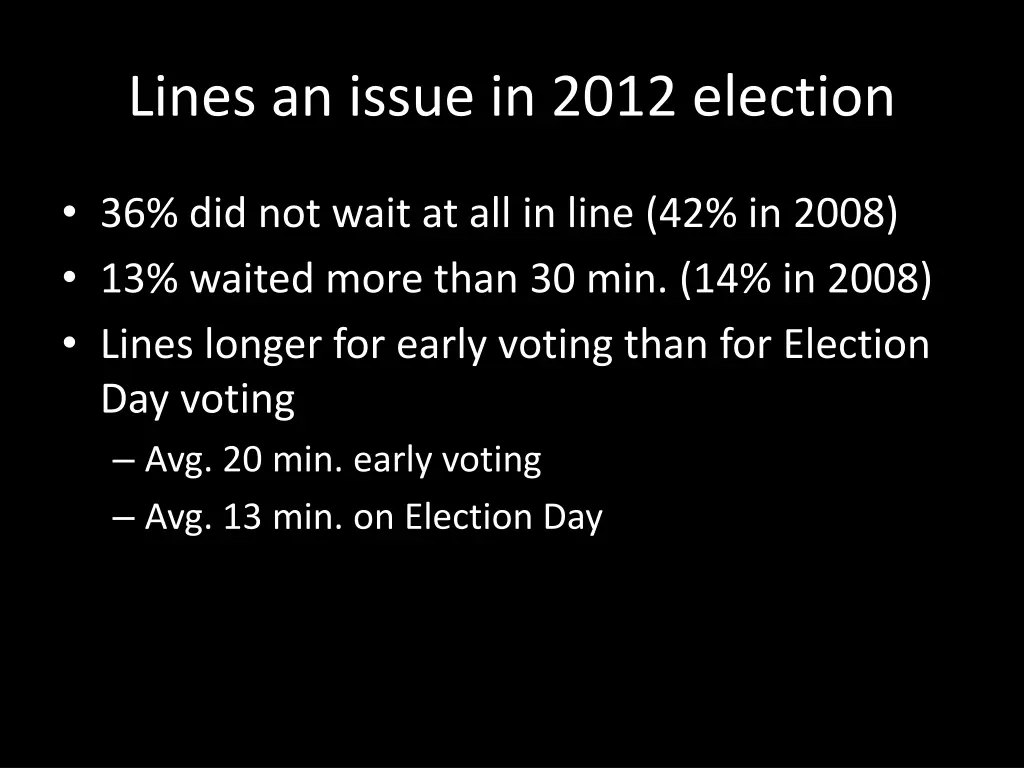
Lines an issue in 2012 election • 36% did not wait at all in line (42% in 2008) • 13% waited more than 30 min. (14% in 2008)
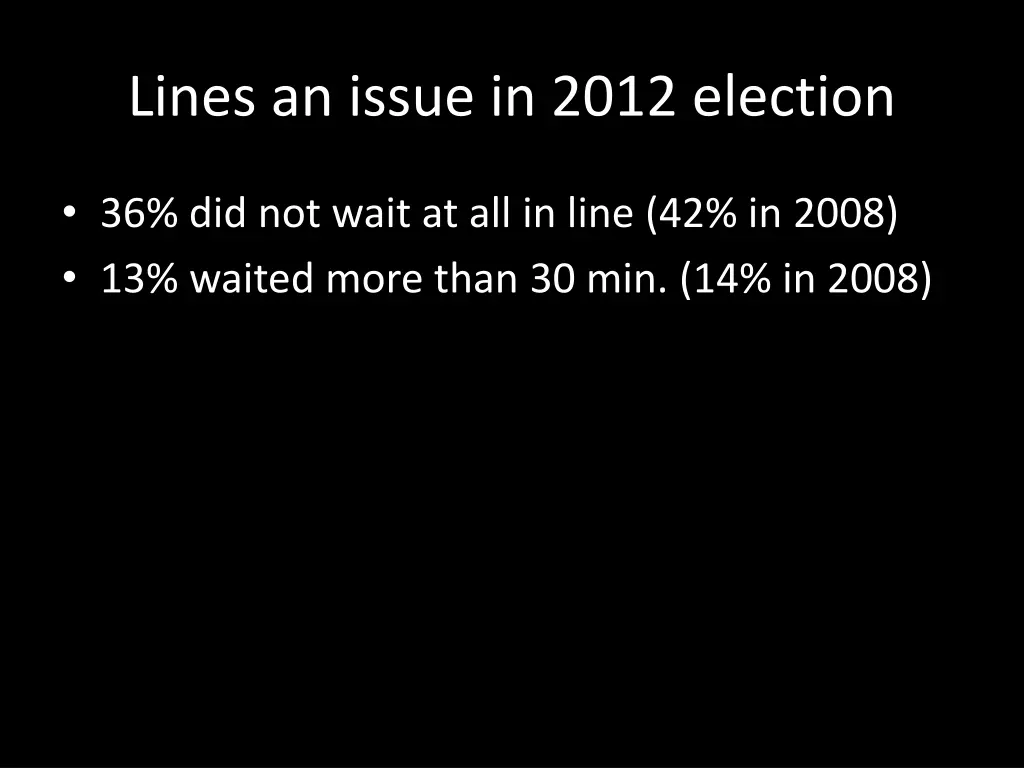
Lines an issue in 2012 election • 36% did not wait at all in line (42% in 2008) • 13% waited more than 30 min. (14% in 2008) • Lines longer for early voting than for Election Day voting – Avg. 20 min. early voting – Avg. 13 min. on Election Day
Charles Stewart III Page 19

Charles Stewart III Page 21

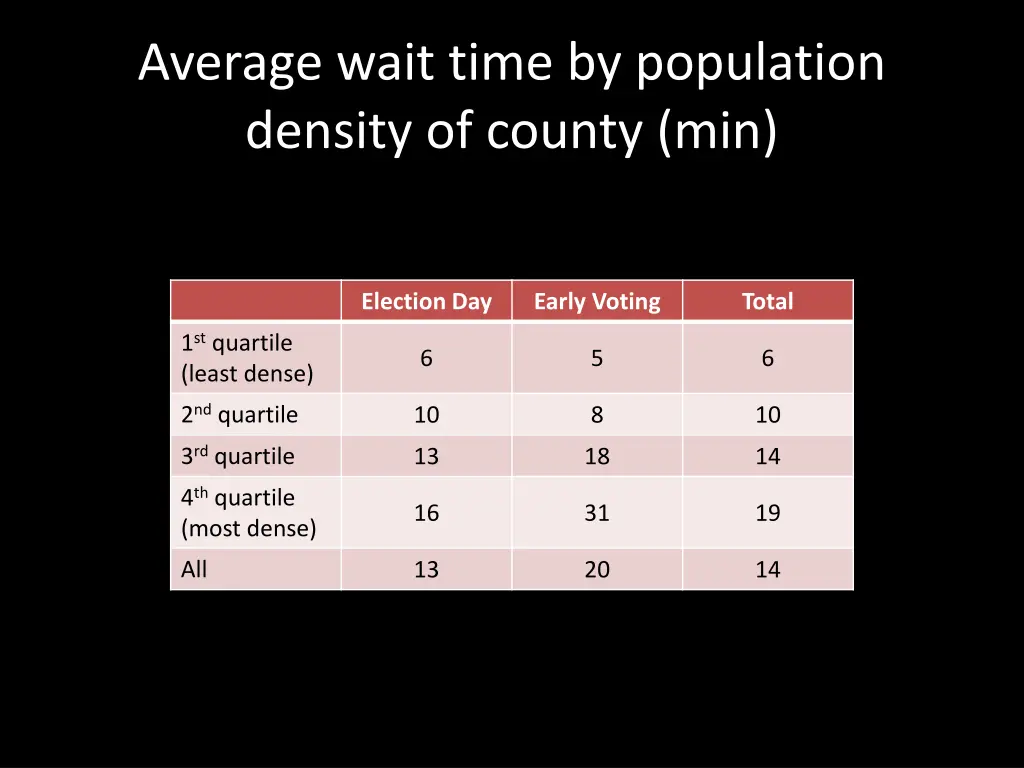
Average wait time by population density of county (min) Election Day Early Voting Total 1stquartile (least dense) 6 5 6 2ndquartile 10 8 10 3rdquartile 13 18 14 4thquartile (most dense) 16 31 19 All 13 20 14
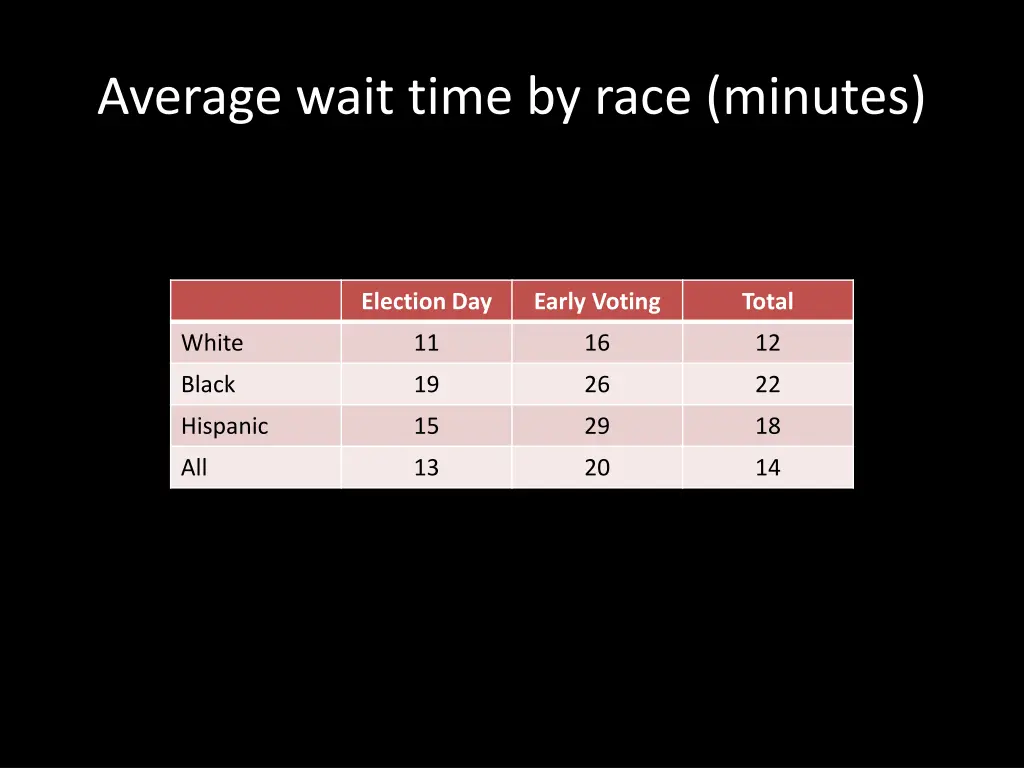
Average wait time by race (minutes) Election Day Early Voting Total White 11 16 12 Black 19 26 22 Hispanic 15 29 18 All 13 20 14
Partisan Divisions on Election Admin.
Partisan Divisions on Election Admin. • Attitudes on confidence • Attitudes on fraud • Attitudes on reform
How confident are you that your vote will be counted as cast? (Pct. saying “very confident”) Dem. Ind. Rep. Total 2008 76% 68% 69% 71%

How confident are you that your vote will be counted as cast? (Pct. saying “very confident”) Dem. Ind. Rep. Total 2008 76% 68% 69% 71% 2012 78% 57% 53% 65%

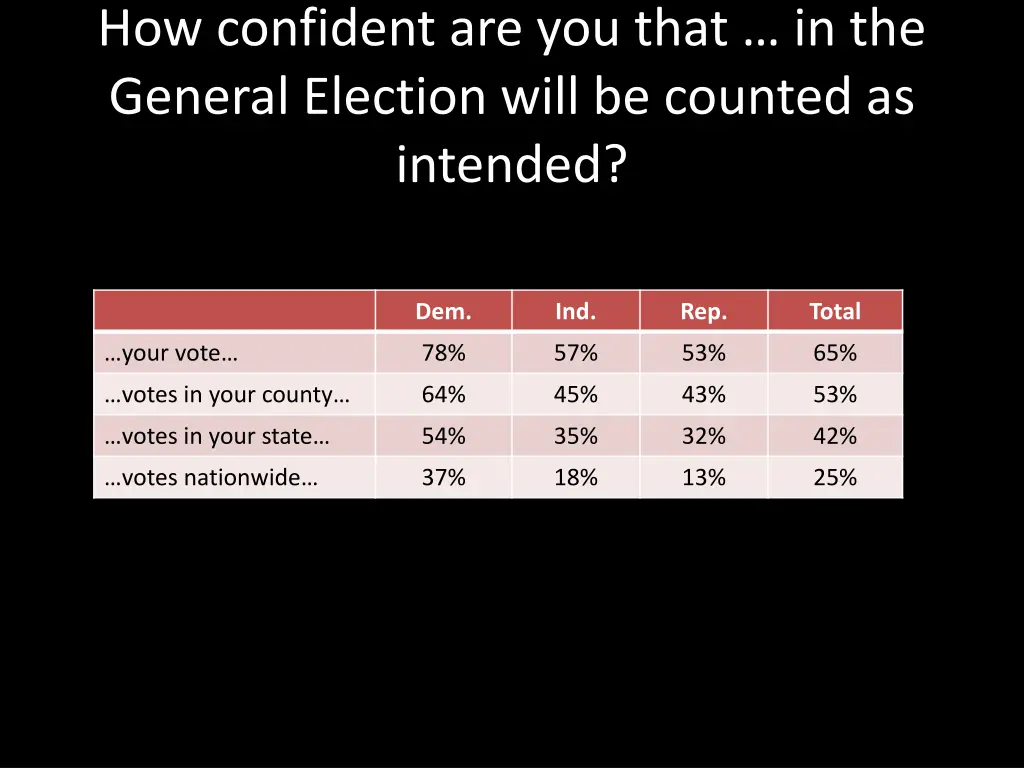
How confident are you that … in the General Election will be counted as intended? Dem. Ind. Rep. Total …your vote… 78% 57% 53% 65% …votes in your county… 64% 45% 43% 53% …votes in your state… 54% 35% 32% 42% …votes nationwide… 37% 18% 13% 25%
It is very common in my city or county… Dem. Ind. Rep. Total Non-citizens voting 9% 25% 35% 21% Absentee ballot fraud 10% 16% 24% 16% People pretending to be others 9% 15% 22% 14% People voting more than once 7% 14% 22% 14% Officials tampering with vote totals 9% 12% 16% 12% People tampering with ballots 9% 11% 17% 12%

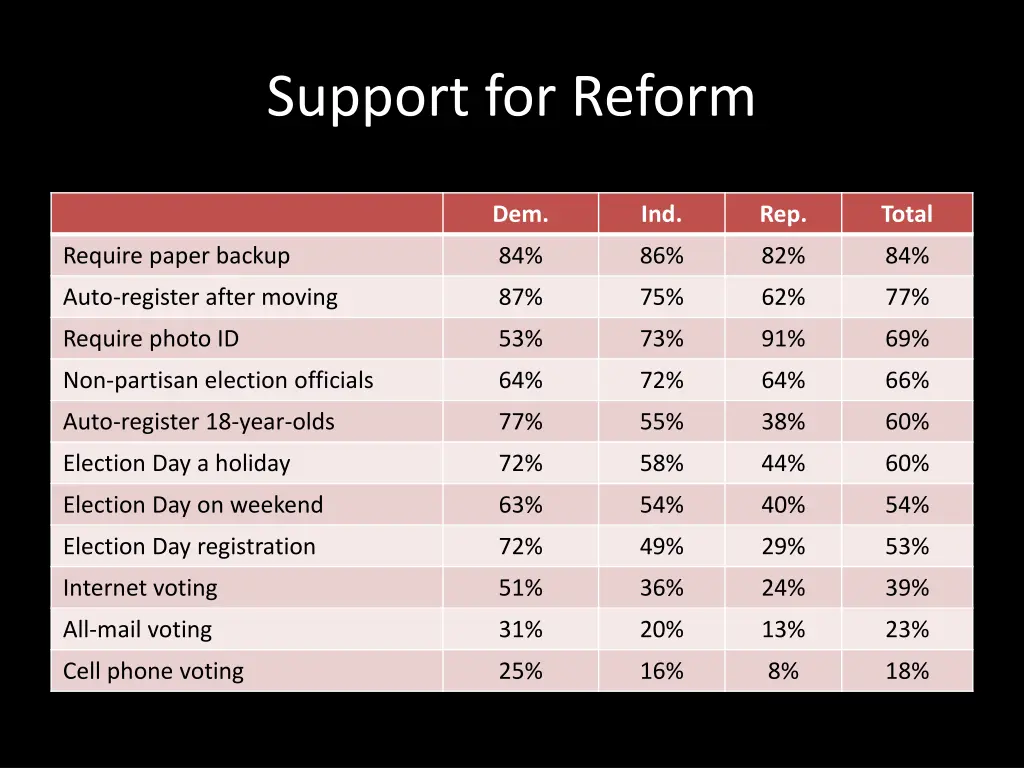
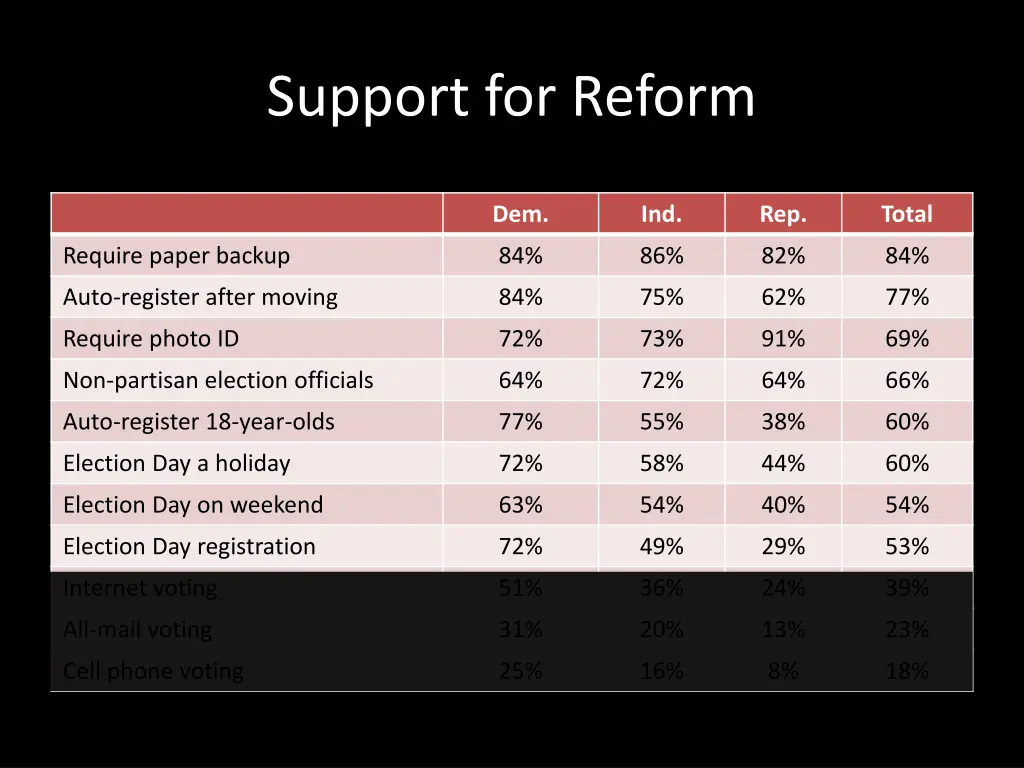
Support for Reform Dem. Ind. Rep. Total Require paper backup 84% 86% 82% 84% Auto-register after moving 87% 75% 62% 77% Require photo ID 53% 73% 91% 69% Non-partisan election officials 64% 72% 64% 66% Auto-register 18-year-olds 77% 55% 38% 60% Election Day a holiday 72% 58% 44% 60% Election Day on weekend 63% 54% 40% 54% Election Day registration 72% 49% 29% 53% Internet voting 51% 36% 24% 39% All-mail voting 31% 20% 13% 23% Cell phone voting 25% 16% 8% 18%
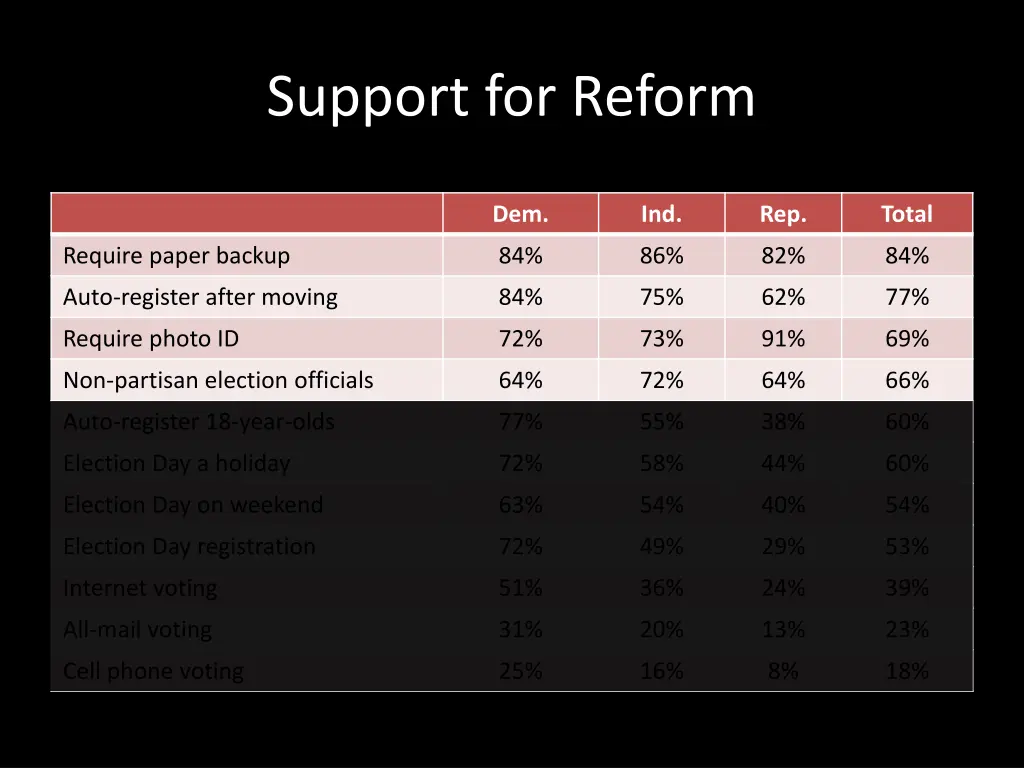
Support for Reform Dem. Ind. Rep. Total Require paper backup 84% 86% 82% 84% Auto-register after moving 84% 75% 62% 77% Require photo ID 72% 73% 91% 69% Non-partisan election officials 64% 72% 64% 66% Auto-register 18-year-olds 77% 55% 38% 60% Election Day a holiday 72% 58% 44% 60% Election Day on weekend 63% 54% 40% 54% Election Day registration 72% 49% 29% 53% Internet voting 51% 36% 24% 39% All-mail voting 31% 20% 13% 23% Cell phone voting 25% 16% 8% 18%
Support for Reform Dem. Ind. Rep. Total Require paper backup 84% 86% 82% 84% Auto-register after moving 84% 75% 62% 77% Require photo ID 72% 73% 91% 69% Non-partisan election officials 64% 72% 64% 66% Auto-register 18-year-olds 77% 55% 38% 60% Election Day a holiday 72% 58% 44% 60% Election Day on weekend 63% 54% 40% 54% Election Day registration 72% 49% 29% 53% Internet voting 51% 36% 24% 39% All-mail voting 31% 20% 13% 23% Cell phone voting 25% 16% 8% 18%
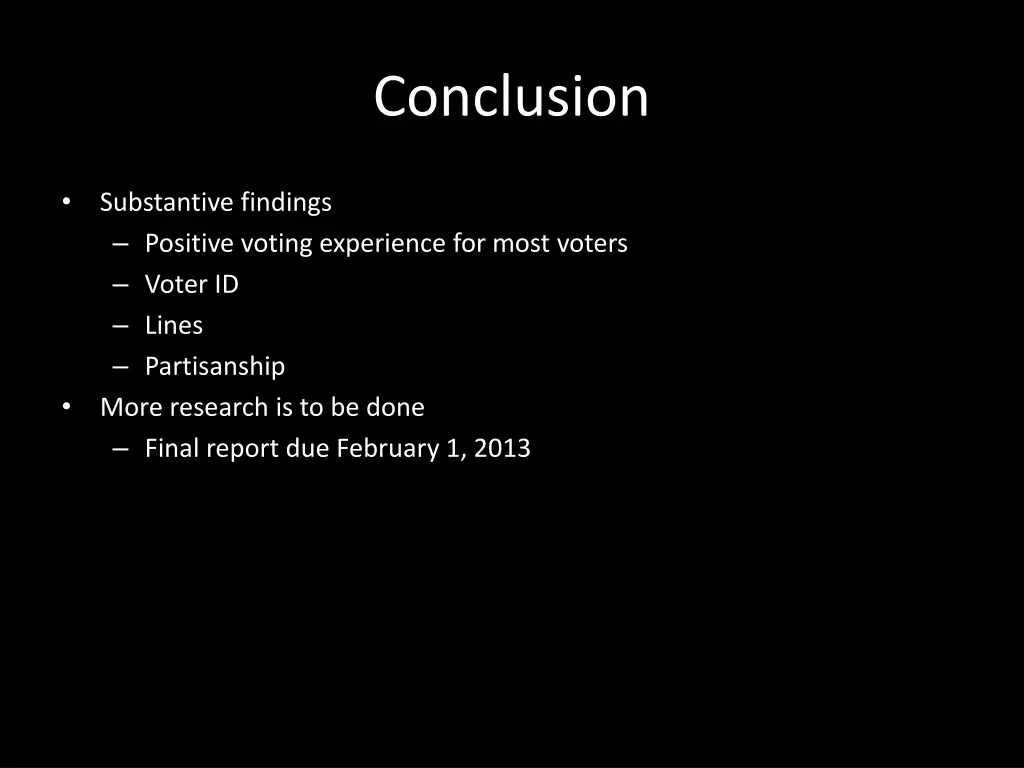
Conclusion • Substantive findings – Positive voting experience for most voters – Voter ID – Lines – Partisanship More research is to be done – Final report due February 1, 2013 •


![[PDF] Free Download American Predator By Maureen Callahan](https://cdn4.slideserve.com/8368869/slide1-dt.jpg)