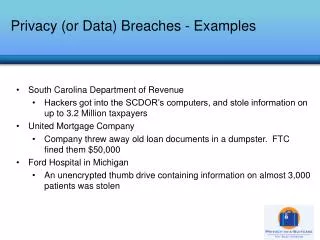
LED Data Examples
Explore LED employment data from Olneyville neighborhood in Providence, RI, to identify trends and correlations between resident employment and local labor market jobs.


LED Data Examples
E N D
Presentation Transcript
LED Data Examples Francisca Winston May 15, 2009
Outline • LED Data as part of the LISC Sustainable Communities Neighborhood Monitoring Project • Results from Olneyville neighborhood in Providence Rhode Island • Resident Employment and Local Labor Market jobs in multiple SC neighborhoods
LISC Research & Assessment is responsible for monitoring neighborhood change in 50 LISC Sustainable Communities (SC) LISC Sustainable Communities Initiative supports community efforts to revitalize low-income neighborhoods through comprehensive approaches to change Targeted program activity in 50 LISC neighborhoods LISC Research & Assessment Neighborhood Monitoring Reports identify levels and trends of neighborhood quality indicators Outcomes are compared to a statistically similar set of low-income neighborhoods in the same city
LISC Sustainable Communities neighborhood monitoring reports currently include data from seven sources
Current LED Employment Indicators Local Labor Market Total Jobs Jobs by Industry Resident Employment Total Jobs Jobs by Industry Job by Earnings Level SC Neighborhoods and Comparison Areas
Olneyville Neighborhood, Providence RI Hispanic Renter-Occupied Low-Income Population: 5138 3549 (70%) age 16+ 1873 (36%) civilian labor force Source: US Census 2000
Increased resident employment is a sign of neighborhood strength Source: Local Employment Dynamics data, analyzed by LISC Research and Assessment
Manufacturing was the largest industry sector of employed residents in Olneyville in 2006 Source: Local Employment Dynamics data, analyzed by LISC Research and Assessment
Employment in health care is increasing but decreasing in manufacturing Source: Local Employment Dynamics data, analyzed by LISC Research and Assessment
In 2006, four industries employed more than half of Olenyville’s working residents Source: Local Employment Dynamics data, analyzed by LISC Research and Assessment
Resident employment in Olneyville and comparison areas is similar Source: Local Employment Dynamics data, analyzed by LISC Research and Assessment
Resident employment is not as correlated with local labor market jobs in Olneyville Source: Local Employment Dynamics data, analyzed by LISC Research and Assessment
Differences between resident employment and local labor market jobs are particularly dramatic in the Southwest SC in Indianapolis Source: Local Employment Dynamics data, analyzed by LISC Research and Assessment
Local labor market jobs are different across all SC Indianapolis neighborhoods Source: Local Employment Dynamics data, analyzed by LISC Research and Assessment
Resident employment is similar across all SC neighborhoods in Indianapolis Source: Local Employment Dynamics data, analyzed by LISC Research and Assessment
Resident employment in SC neighborhoods can be different across cities Source: Local Employment Dynamics data, analyzed by LISC Research and Assessment
Next Steps in LED • Explore differences between resident employment and local labor market jobs in other cities • Consider if workforce development programs need to be targeted to specific neighborhoods • Examine LED data with other data sources
Olneyville Neighborhood, Providence RI Hispanic Renter-Occupied Low-Income Population: 5138 3549 (70%) age 16+ 1873 (36%) civilian labor force Source: US Census 2000
LISC has worked with community organizations to revitalize underserved neighborhoods since 1990 Invested $9 billion residential and commercial development 245,000 affordable homes & apartments Facilities for child care, schools, the arts, & playing fields 36 million sq feet of retail & business
In 2006, four industries employed more than half of Olneyville’s working residents Local Employment Dynamics data, analyzed by LISC Research and Assessment