Download
1 / 50
510 likes | 658 Views
Learn about ESR principles, experiments, applications, and possibilities, including theoretical foundations and practical examples for molecular dynamics studies. Explore ESR distance measurements and spin labeling techniques in various fields.

E N D
An Introduction to Electron Spin Resonance (ESR) Boris Dzikovski, ACERT, Cornell University • The application field • The basic ESR experiment. • Some theoretical background. • Nitroxide spin labels. • Some examples for extraction of parameters of molecular dynamics from ESR spectra • Site directed spin labeling (SDSL) • ESR distance measurements An introduction to Electron Spin Resonance (ESR), November 7, 2007
ESR is a spectroscopic technique that detects chemical species that have unpaired electrons : • Transition metal ions and complexes Mn2+, Cu2+, Gd 3+ etc. • Simple inorganic compounds: O2 , NO, NO2 …. • Short-lived intermediate radicals OH, H, F etc. in kinetics study • Defects in crystals • Electrons trapped in radiation damaged sites • Stable organic radicals • Triplet states • Biological applications: • Paramagnetic cofactors: iron sulfur, copper proteins • Free radicals of biological origin and their spin-trapping products • Spin-labeling An introduction to Electron Spin Resonance (ESR), November 7, 2007
Energy-level diagram for two spin states as a function of applied field H. This represents the simplest ESR transition (e.g., free electrons). “Allowed” EPR transitions occur when êDMsê= 1 (Ms is the magnetic spin quantum number of the spin state). The equation describing the absorption (or emission) of microwave energy between two spin states is DE = hu = gbH where: DE is the energy difference between the two spin states h is Planck’s constant uis the microwave frequency g is the Zeeman splitting factor (2.0023 for free electron) b is the Bohr magneton H is the applied magnetic field. H An introduction to Electron Spin Resonance (ESR), November 7, 2007
Relaxation Evolution of a spin system is described by Bloch equations: Mx’, My’ Mz – magnetization components in the rotating frame 0=eH0 – the Larmor Frequency T1- spin-lattice or longitudinal relaxation time T2- spin-spin or traverse relaxation time When properly integrated, the Bloch equations will yield the X', Y', and Z components of magnetization as a function of time. Stationary solution in the rotating frame gives a lorentzian line = inhomogeneous broadening Gaussian line k=1 Lorentz ESR linewidth: Gauss An introduction to Electron Spin Resonance (ESR), November 7, 2007
ESR and NMR are very different methods! Frequency: Factor 1000 larger in EPR ! (GHz instead of MHz) Coupling strength: Factor 1 000 000 larger in EPR ! (MHz instead of Hz) Relaxation Times: Factor 1000 000 smaller in EPR ! (ns instead of ms) = much higher techniqual requirements, but unique sensitivity to molecular motion Sensitivity : Factor 1 000 000 better than in NMR !! (1nM instead of 1mM ) An ideal case, though An introduction to Electron Spin Resonance (ESR), November 7, 2007
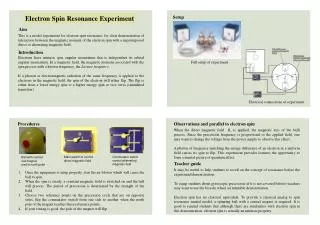
The Basic ESR Experiment (conventional ESR) Circulator Detector Source electromagnet Modulation coils Resonator (cavity) An introduction to Electron Spin Resonance (ESR), November 7, 2007
The Basic ESR Experiment (conventional ESR) Unlike NMR a large proportion of machines are still 'cw'. That is they do not use pulsed detection methods • ESR is done from 1 to 300+GHz [30mT-10T or 30cm-1mm], up to 2000+ GHz • Machines are classified according to their source frequency : Commonly used X-band at 9.5 GHzL (1.5), S (3.0), C (6.0),Ku (17), K (23), Q (36), V (50), W (95), D(140),G(180) • Field modulation is used to encode the spectrum [1st derivative lineshape] • Use microwave transmission lines • Do spectroscopy with a few microwatts to a few milliwatts of power • Solid state [Gunn diode or DRO] or tube [klystron] sources • Temperaturesfrom 4K (heme and non-heme iron) to 310K+ (in vivo/vitro) • Sensitivity : Increases as (frequency)2, but limited by sample size, field • homogeneity and component construction problems. • Practically (at X-band): detect 1011 spins, • a detectable concentration of ~10-9M. An introduction to Electron Spin Resonance (ESR), November 7, 2007
Field modulation An introduction to Electron Spin Resonance (ESR), November 7, 2007
A commercial 9GHz system An introduction to Electron Spin Resonance (ESR), November 7, 2007
Commercial 95GHz Spectrometer (3T) An introduction to Electron Spin Resonance (ESR), November 7, 2007
The g-factor: DE = hu = gbH The field at each spin influenced by local magnetic fields, not just the external field : Heft = H + Hlocal so Heff = (1-s)H = (g/ge)H -This field is induced by H, and so depends on the external field H • -g is an effective Zeeman factor, shifted from the electron g-factor, ge • -The shift in g is akin to the chemical shift of NMR -The local induced field comes from the orbital motion of electrons, spin-orbit coupling mixes J, L and S and shifts g, the shift can can be g<2 or g>2. g is thus characteristic of different electronic structures and is also known as the Landé splitting factor: • Light atoms, i.e.'organic' and first row transition metals with a single unpaired electron • can have g close to 2.0 • Heavier atoms, and molecules or atoms with more than one unpaired electron can • have g-values very different from 2 An introduction to Electron Spin Resonance (ESR), November 7, 2007
g-values for some biologically important paramagnetic compounds An introduction to Electron Spin Resonance (ESR), November 7, 2007
A - the hyperfine splitting The unpaired electron, which gives us the EPR spectrum, is very sensitive to local fields in its surroundings. Local fields arising from magnetic nuclei are permanent and independent of H. Interaction with neighboring nuclear magnetic dipoles gives the nuclear hyperfine interaction and hyperfine splitting A Corresponds to the NMR coupling constant J A splittings are independent of the external field. For several equivalent nuclei n, (2nMIM + 1) transitions are observed for a nucleus M with a spin I The relative intensities are given by Pascal's triangle for I = ½ 11 11 2 11 3 3 11 4 6 4 11 5 10 10 5 11 6 15 20 15 6 11 7 21 35 35 21 7 1 An introduction to Electron Spin Resonance (ESR), November 7, 2007
I=1/2, 2I+1=2 I=1, 2I+1=3 An introduction to Electron Spin Resonance (ESR), November 7, 2007
Organic radicals in the liquid phase Cyclooctatetraen anion Butadien ion in liquid NH3 Pyrazine anion Na+ is the counterion Observation of the 1:8:28:56:70:56:28:8:1 spectrum shows that eight protons are equivalent Two sets of equivalent protons: 2 and 4 K+ is the counterion The figures are taken from the textbook by Wertz&Bolton An introduction to Electron Spin Resonance (ESR), November 7, 2007
Anisotropy in g and A Many measurements are made in the solid state in EPR spectroscopy. The ability of EPR to obtain useful information from amorphous (glassy) and polycrystalline (powders) as well as from single crystal materials has attracted much biology and biochemistry research Usually : gX, gY, gZ are not all equal, so g is anisotropic. Same for AX, AY, AZ. • For EPR the local symmetry at an unpaired electron center is categorised as : • Cubic. If x = y = z is cubic (cubal, octahedral, tetrahedral) No anisotropy in g and A. • Uniaxial (Axial). If x = y, and z is unique. Linear rotation symmetry (at least 3-fold). Two principal values each for g and A. For an arbitrary orientation: • Rhombic. Three unequal components for g and A • For an arbitrary orientation: An introduction to Electron Spin Resonance (ESR), November 7, 2007
gx=2.0091, gy=2.0061, gz=2.0023 The field shift between the X- and Z- orientations is H=h/gx- h/gz hg/4~11G An introduction to Electron Spin Resonance (ESR), November 7, 2007
gx=2.0091, gy=2.0061, gz=2.0023 I=1/2, Ax= 6.2, Ay = 6.3, Az=33.6 An introduction to Electron Spin Resonance (ESR), November 7, 2007
gx=2.0091, gy=2.0061, gz=2.0023 I=1, Ax= 6.2, Ay = 6.3, Az=33.6 An introduction to Electron Spin Resonance (ESR), November 7, 2007
Powder and glass spectra S=1/2, I=0, gx=gy<>gz Axially symmetric g-factor is the angle between a given symmetry axis and the magnetic field direction The given solid angle Wis defined to be the ratio of the surface area A to the total surface area on the sphere: W= A/4pr2 dW=2pr2sinqdq/4pr2=sinqdq/2 An introduction to Electron Spin Resonance (ESR), November 7, 2007
An introduction to Electron Spin Resonance (ESR), November 7, 2007
EPR Middle-Earth An introduction to Electron Spin Resonance (ESR), November 7, 2007
ESR signals around us Toothpaste Human hair Q-band ESR spectrum of molecular oxygen at reduced pressure EPR dosimetry: 5000 10000 15000 G The rotational angular momentum, which is quenched in the liquid or solid phases couples strongly to the electronic spin and orbital angular momenta… Determination of the accumulated radiation dose by ESR of tooth enamel An introduction to Electron Spin Resonance (ESR), November 7, 2007
Nitroxide spin labels The g- and A-tensor frame for a nitroxide radical An introduction to Electron Spin Resonance (ESR), An introduction to Electron Spin Resonance (ESR), November 7, 2007
gx=2.0091, gy=2.0061, gz=2.0023 I=1, Ax= 6.2, Ay = 6.3, Az=33.6 9.4 GHz An introduction to Electron Spin Resonance (ESR), An introduction to Electron Spin Resonance (ESR), November 7, 2007
Angular averaging in the case of S=1/2, I=1, gx=2.0089, gy=2.0061, gz=2.0027, Ax= 5.2, Ay = 5.2, Az=31.0, X-Band component I=+1 is spread over A- hg/4 component I=0 is spread over hg/4 component -1 is spread over A+ hg/4 The figures are from the monograph by Kuznetsov An introduction to Electron Spin Resonance (ESR), An introduction to Electron Spin Resonance (ESR), November 7, 2007
High field EPR spectroscopy is the g-resolved spectroscopy, the regions corresponding different orientations of the magnetic axis relative to the external magnetic field do not overlap An introduction to Electron Spin Resonance (ESR), An introduction to Electron Spin Resonance (ESR), November 7, 2007
gx=2.0091, gy=2.0061, gz=2.0023 I=1, Ax= 6.2, Ay = 6.3, Az=33.6 170 GHz An introduction to Electron Spin Resonance (ESR), November 7, 2007
Nitroxyl tumbling correlation time As the molecule tumbles, the smaller splitting for mI = 0 is averaged more effectively than the larger splittings, which causes differences in the linewidths of the three hyperfine lines: An introduction to Electron Spin Resonance (ESR), November 7, 2007
Nitroxyl Lineshapes As the tumbling correlation time decreases, the extent of averaging of anisotropic features increases and the spectrum approaches the 3-line signal that is characteristic of rapid tumbling. In the motional narrowing region, the dependence of the width of an individual hyperfine line on the nuclear spin state (mI)can be expressed as Rotation correlation times between 10-11 and 10-6 are detectable by ESR X-band An introduction to Electron Spin Resonance (ESR), November 7, 2007
Calculation of tumbling times in the case of fast isotropic tumbling The parameters B and C are related to peak-to-peak amplitudes, I(mI) by: The high-field line has mI = -1. Tumbling correlation times are calculated from B and C using and Where DBo is the peak-to-peak width of the center line Hyperfine values (A) are in radians/s The calculation assumes isotropic tumbling An introduction to Electron Spin Resonance (ESR), November 7, 2007
Sample Calculation 4-OH-TEMPO (tempol) in 9:1 glycerol:water • gx = 2.0094, gy = 2.0059, gz = 2.0023 • Ax = 2p 18x106, Ay = 2p 22.5x10⁶, Az = 2p 103x106 rad/s • I(+1) = 13.5, I(0) = 16.4, I(-1) = 3.4 (arbitrary units) • DBo = 3.52 Gauss b = 9.274x10⁻²¹ erg/G • = 9.2449x10⁹ s-1 h=6.626x10⁻²⁷ erg s • = 2.1x10⁻⁹ s from B or t = 2.3x10⁻⁹ s from C The disagreement is an indication of the approximate nature of this calculation. Determination of microviscosity: (Stocks-Einstein) Extremely useful in oversaturated/overcooled disperse systems. Example: testing photographic materials An introduction to Electron Spin Resonance (ESR), November 7, 2007
g- and A- tensors are sensitive to the local polarity gxgygz giso AxAyAzAiso Toluene 2.00986 2.00626 2.00222 2.00617 6.2 7.0 34.3 15.6 Water/glyc 2.00878 2.00604 2.00215 2.00565 6.9 7.9 37.4 17.4 TEMPO in Emulsion: toluene/SDS/water An introduction to Electron Spin Resonance (ESR), November 7, 2007
TEMPO in the LQ phase of DLPC Partially A-resolved g-resolved spectra An introduction to Electron Spin Resonance (ESR), November 7, 2007
Orientational resolution of HF ESR for nitroxide spin labels One of the main virtues of HF ESR over ESR at conventional microwave frequency is the excellent orientational resolution for nitroxide spin labels. At HF, once motion is discernable in the spectrum, one can discern about which axis the motion occurs. Spin labeled fatty acids in solid cyclodextrins An introduction to Electron Spin Resonance (ESR), November 7, 2007
Z-rotation vs. slow motion Averaging effective tensor components (gxx+ gyy)/2, (gxx+ gyy)/2,gzz (Axx+ Ayy)/2, (Axx+ Ayy)/2Azz Averaging real tensor components gxx, gyy, gzz, Axx, Ayy, Azz An introduction to Electron Spin Resonance (ESR), November 7, 2007
X-rotation Averaging effective tensor components gxx,, (gyy+ gzz)/2, (gyy+ gzz)/2, Axx,(Ayy+ Azz)/2, (Ayy+ Azz)/2 An introduction to Electron Spin Resonance (ESR), November 7, 2007
Diffusion tilt angle Y-rotation Averaging effective tensor components (gxx+ gzz)/2, gyy, (gxx+ gzz)/2, (Axx+ Azz)/2, Ayy,(Axx+ Azz)/2 An introduction to Electron Spin Resonance (ESR), November 7, 2007
Lipid spin labels Y-ordering Z-ordering X-ordering An introduction to Electron Spin Resonance (ESR), November 7, 2007
ESR is one of the most powerful tools in lipid research Phase state of lipids Interaction of lipid with proteins, formation of lipoproteids, boundary lipid etc. Domains in model and biological membranes Diffusion studies in the membrane phase Polarity profiles in membranes Membrane permeation profiles for oxygen and paramagnetic ions An introduction to Electron Spin Resonance (ESR), November 7, 2007
ESR on aligned membranes Spin-labeled gramicidin A in DPPC, 220 C Aligned membrane Vesicles Simulation of angular dependent spectra is much freer of ambiguity, compared to vesicles Application of aligned membranes allows extracting information on relative orientation of diffusion and magnetic axes, which can not be obtained from vesicles An introduction to Electron Spin Resonance (ESR), November 7, 2007
Spin labeled Gramicidin A in DPPC at 170 GHz An introduction to Electron Spin Resonance (ESR), November 7, 2007
MOMD: microscopic order – macroscopic disorder. An important case in biology All orientations of the membrane normal relative to the magnetic field are averaged in vesicles: gx=2.0091, gy=2.0061, gz=2.0023 I=1, Ax= 6.2, Ay = 6.3, Az=33.6 9 GHz 170 GHz n n X Z For a macroscopically disordered sample the orientation of the nitroxide moiety manifests itself as a result of anisotropic molecular motion around the principal axis of the molecular frame
Spin labeling. Peptides and proteins Nitroxides are introduced into proteins as reporter groups to provide information about local environment, overall tumbling rate of the protein or/and segmental mobility, accessibility of the labeling site for polar/non-polar molecules, distance measurements to other spin labels, co-factors, membrane surface…. Labeling of the hydroxyl group MTSL spin label is cysteine specific. SDSL = site directed spin labeling is introducing cysteines into the protein molecule by point mutations with following MTSL labeling. Cysteine mapping of the protein molecule. An introduction to Electron Spin Resonance (ESR), November 7, 2007
T4 lysozyme – an example of successful EPR mapping Multifrequency approach: high field EPR (250 GHz) spectra are insensitive to the slow overall tumbling motion of the protein and indicative of the internal motion The 9 GHz spectra significantly affected by the overall tumbling and less sensitive to the internal dynamics. An introduction to Electron Spin Resonance (ESR), November 7, 2007
Multifrequency Analysis Time scale R (s-1) Note:τR = (6R)-1 An introduction to Electron Spin Resonance (ESR), November 7, 2007
Oxygen Accessibility Oxygen accessibility and probe mobility were measured as a function of sequence number for spin labels attached to T4 lysozyme (T4L) and cellular retinol binding protein (CRBP). The correlation between the two parameters indicates that the most mobile sites are also the most oxygen accessible. The repeat period of about 3.6 for T4L is consistent with the a-helical structure of this segment of the protein. W. L. Hubbell, H. S. Mchaourab, C. Altenbach, and M. A. Lietzow, Structure4, 779-783 (1996). An introduction to Electron Spin Resonance (ESR), November 7, 2007
ESR distance measurements Dipole-dipole interaction between two spins: Proportional to (interspin distance)-3angular dependent splitting. Averaging over all orientations gives the Pake Doublet: An introduction to Electron Spin Resonance (ESR), November 7, 2007
Some modern pulse EPR techniques (DQC, DEER) can cancel out all interactions resulting in an EPR spectrum except the dipole interaction in spinpairs Example: spin labeled Gramicidin A Interspin distance= ndipolar, MHz, An introduction to Electron Spin Resonance (ESR), November 7, 2007
DQC-EPR ruler: Location of mobile domains in a protein complex using DQC-ESR: An introduction to Electron Spin Resonance (ESR), November 7, 2007