
Analyzing Gene Expression Factors in K562 Cells Over Time
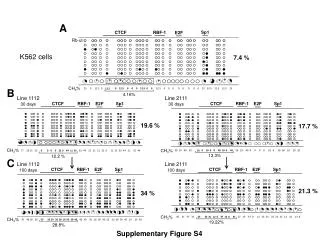
This study explores the influence of various transcription factors, particularly CTCF, RBF-1, E2F, and Sp1, on gene expression in K562 cells over a span of 30 and 100 days, using methylation status and various CH3-level conditions as parameters. We observed varying expression levels and interactions among these key factors, which can significantly impact cellular functions and regulatory mechanisms in hematological cancers. Detailed results are provided in Supplementary Figure S4, showcasing the expression patterns under different conditions.

Analyzing Gene Expression Factors in K562 Cells Over Time
E N D
Presentation Transcript
CTCF CTCF CTCF CTCF RBF-1 RBF-1 RBF-1 RBF-1 E2F E2F E2F E2F Sp1 Sp1 Sp1 Sp1 A Sp1 CTCF RBF-1 E2F Rb-ut K562 cells 7.4 % CH3% B 0 25 62.5 12.5 12.5 25 25 0 12.5 0 0 12.5 0 0 0 12.5 0 0 12.5 0 0 0 0 0 0 0 12.5 4.16% Line 1112 30 days Line 2111 30 days 19.6 % 17.7 % CH3% CH3% 50 10 40 30 0 10 0 0 40 10 0 40 30 10 40 0 0 0 0 10 0 30 50 10 20 20 77 33 11 55 0 0 0 0 22 0 44 11 33 33 44 22 11 11 22 0 11 22 33 44 11 55 44 20 13.3% 12.2 % C Line 1112 100 days Line 2111 100 days 21.3 % 34 % CH3% 25 50 37 37 25 25 25 12 0 37 12 0 37 37 25 37 0 12 25 25 25 25 25 12 25 12 0 CH3% 70 40 50 50 50 20 20 20 30 10 50 20 40 40 40 20 10 30 40 30 30 30 50 40 10 30 50 19.22% 28.8% Supplementary Figure S4