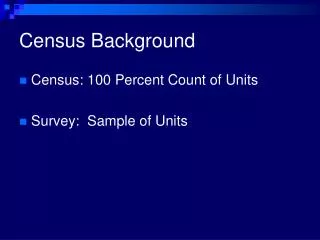
Enhancing Data Anonymity: The SAFE Method for German Census Confidentiality
130 likes | 258 Views
The SAFE method is a groundbreaking pretabular technique designed to anonymize microdata from the German Census, ensuring compliance with the confidentiality regulations under German law. It generates anonymous microdata files that cannot be linked back to individuals, thus protecting their identities. While it streamlines analysis and avoids the necessity of cell suppression, it introduces challenges such as new interpretations of data tables and potential complexity in calculations. This paper discusses advantages, disadvantages, and practical applications of the SAFE method in census data handling.

Enhancing Data Anonymity: The SAFE Method for German Census Confidentiality
E N D
Presentation Transcript
SAFE –a method for anonymising the German Census Joint UNECE/Eurostat Work Session on Statistical Data Confidentiality (Tarragona, Spain)
SAFE - a pretabularmethod(1) SAFE creates an anonymous micro data file. What are anonymous micro data? • Micro data are anonymous (confidential), “if they cannot be matched to the concerned person.”(German law of Statistics §16). • Identification can be avoided by ambiguous records in the micro data file. • SAFE - micro data files are confidential because of ambiguity in the record set. State Statistical InstituteBerlin-Brandenburg
SAFE - a pretabularmethod (2) Advantages: • Solution in one step • Analysis can reidentify only the anonymous micro data file • All analysis based on the same source and are consistent • No cell suppression (primary or secondary) necessary Disadvantages: • Change from cell suppression to uncertainty in cell values • New interpretation of tables • No easy extension of analysis to not controlled tables • Calculation effort may be relatively great State Statistical InstituteBerlin-Brandenburg
96-... 96-... region region 91-95 91-95 86-90 86-90 5 5 4 4 81-85 81-85 3 3 76-80 76-80 2 2 1 1 71-75 71-75 66-70 66-70 61-65 61-65 56-60 56-60 51-55 51-55 46-50 46-50 41-45 41-45 36-40 36-40 31-35 31-35 26-30 26-30 21-25 21-25 16-20 16-20 11-15 11-15 6-10 6-10 0-5 0-5 15 10 5 0 0 5 10 15 15 10 5 0 0 5 10 15 male female male female Idea of SAFE - solution (1) original anonymous • only triplets • data attacks (reidentification) lead to more than two objects State Statistical InstituteBerlin-Brandenburg
96-100 Inhabitants by region and sex region 91-95 (left: original right: anonymous) original 86-90 80 5 4 81-85 female 3 70 76-80 2 male 71-75 1 60 66-70 50 61-65 56-60 40 persons 51-55 46-50 30 41-45 20 36-40 31-35 10 26-30 0 21-25 16-20 1 2 3 4 5 11-15 female male region 6-10 52% 48% 0-5 15 10 5 0 0 5 10 15 male female 96-100 region 91-95 25 86-90 5 4 inhabitants by age and sex 81-85 3 (left: original right: anonymous) 76-80 2 20 1 71-75 66-70 female 61-65 male 56-60 15 51-55 46-50 persons 41-45 10 36-40 31-35 26-30 5 21-25 16-20 11-15 0 6-10 0-5 6-10 11-15 16-20 21-25 26-30 31-35 36-40 41-45 46-50 51-55 56-60 61-65 66-70 71-75 76-80 81-85 86-90 91-95 96-100 0-5 15 10 5 0 0 5 10 15 male female Age in 5 years Idea of SAFE - solution (2) • no real data, only triplets • but the analysis should be as similar as possible to the original micro data file anonymous State Statistical InstituteBerlin-Brandenburg
Mathematical model of SAFE (1) with: y - vector of frequencies of category combinations in the micro data a - vector of original frequencies in controlled table cells A - linear relation matrix d - vector of deviation trough tabulation of anonymised micro data instead of original data di as deviation in table cell j w - vector of weights for table cells State Statistical InstituteBerlin-Brandenburg
Adaption for the census different units: persons, housings, buildings are different units of the census with hierarchical dependencies. • Splitting the micro data set in different variable blocks(persons: region, age, sex, profession, ...housing: region, heating (oil, gas,...), bath, ...building: construction year, size, ...) • Counting variable for person, housing, building. Create control-table with counting variables. Persons were splitted from housing and building information. Housing and building in one data set with different counting variables. State Statistical InstituteBerlin-Brandenburg
SAFE – tests with census 1987 West Germany (1) micro data file for persons register State Statistical InstituteBerlin-Brandenburg
SAFE – tests with census 1987 West Germany (2) micro data file for persons register State Statistical InstituteBerlin-Brandenburg
SAFE – tests with census 1987 West Germany (1) micro data file for housing and building State Statistical InstituteBerlin-Brandenburg
SAFE – tests with census 1987 West Germany (2) micro data file for housing and building State Statistical InstituteBerlin-Brandenburg
Interpretation of results SAFE solutions are: • Like “noise” added to table cells. • Maximal deviation is known and documented. • Relative deviation in cells decreases in greater table cell values. • Missing combinations are unlikely but not sure not existing. • Unique combinations in table row (line or column) do not allow an information gain (group disclosure problem) through not sure uniqueness in the original data. • Good preservation of structure in the data. No missing information through complementary cell suppression. State Statistical InstituteBerlin-Brandenburg
Thank you for your attention! State Statistical InstituteBerlin-Brandenburg