Download
1 / 20
250 likes | 566 Views
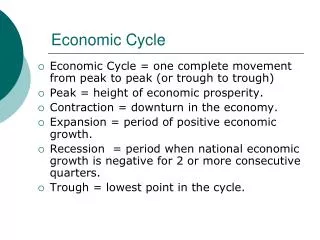
The Business Cycle and Economic Activity. What is the difference between a decrease in GDP and a decrease in GDP growth? Explain the cyclical pattern of economies using the business cycle diagram Explain the concept of potential output and its relationship to the “output gap”. Peak. Peak.

E N D
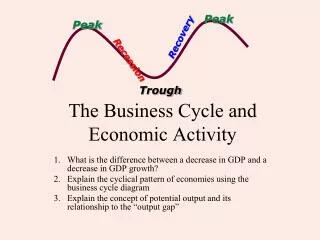
The Business Cycle and Economic Activity What is the difference between a decrease in GDP and a decrease in GDP growth? Explain the cyclical pattern of economies using the business cycle diagram Explain the concept of potential output and its relationship to the “output gap” Peak Peak Recovery Recession Trough
Remember: • Economicgrowth-increases in the quantity of output produced over a period of time (year) and expressed as: • %change in real GDP/GNI over period of time • %change in real GDP/GNI per capita over a period of time • i.e., real GDP in 2004 was $50bil and increased to $51bil in 2005, rate of growth is ((new-old/old)*100), so rate of growth was +2% • Remember, %change representing growth is not always positive value; if real GDP has fallen, it will be negative • real GDP in 2006 was $60bil and decreased to $57bil in 2007, rate of growth is ((new-old/old)*100), so rate of growth was -5%
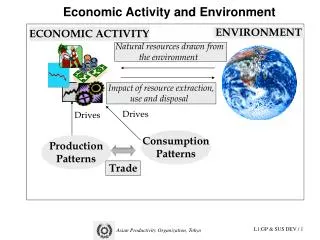
The same information shown on the business cycle can be shown on a production possibilities curve: Full employment Unemployment Inflation The shifters of the PPC affect GDP: Change in quantity/quality of resources Changes in technology Changes in trade Why is economic growth the goal of every society? Provides better goods and services Increases wages and standard of living Allows more leisure time Economy can better meet wants Remember…
Decrease in GDP vs. GDP growth • Decrease inGDP-fall in the value of output produced, such as ex. #2 on last slide • Decrease in GDP growth- falling rates of growth, though rates of growth may be positive (see ex )
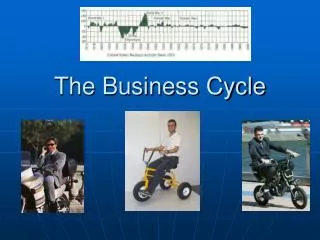
Business Cycles (aka economic fluctuations) • Real output in most countries grows over long periods of time, but output growth is uneven and irregular • business cycle -recurrent fluctuations in growth of real output (“ups and downs”) in the level of economic activity • Alternating periods of expansion (increasing real output) and contraction (decreasing real output) • Individual business cycles may vary greatly in duration and intensity • All display a set of phases
THE BUSINESS CYCLE Phases of the Business Cycle
Expansion occurs when there is positive growth in real GDP (upward sloping parts of curve) During these periods: Employment of resources increases General price level (average overall prices) begins to rise rapidly Beginning of inflation Expansion
PEAK GROWTH TREND Level of business activity Time • Peak (prosperity phase): • Real output in the economy is at a high level (max real GDP) • Marks end of expansion • Unemployment is low • Domestic output may be at capacity (price level increases rapidly) • Inflation may be high
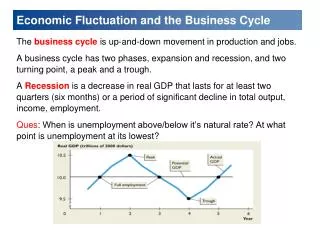
RECESSION GROWTH TREND Level of business activity Time • Contraction (recession) phase: • Recession – government determinant of two consecutive quarters (6 months) of declining output • Real output is decreasing (falling real GDP, negative growth) • If the recession is prolonged, price may decline (deflation) • As contraction continues, inflation pressure fades • Unemployment rate is rising
TROUGH GROWTH TREND Level of business activity Time • Trough (depression) phase: • Minimum (lowest) point of real GDP • end of contraction • Widespread unemployment; output at lowest point • may be short- or long-term • no precise way to tell where decreased output (serious recession) becomes a depression
One cycle Business Cycle-one cycle through 4 phases Peak Peak Real GDP per year Recovery Recession Trough Time
Recessions since 1950 show that duration and depth are varied: Period Duration in months Depth(decline in real GDP) 1953-54 10 — 3.0% 1957-58 8 — 3.5% 1960-61 10 — 1.0% 1969-70 11 — 1.1% 1973-75 16 — 4.3% 1980 6 — 3.4% 1981-82 16 — 2.6% 1990-91 8 — 2.6% 2001 8 app. —3.3%
Causes of Fluctuations • Innovation • Political events • Random events • Wars • Level of consumer spending • Seasonal fluctuations • Cyclical Impacts — durable and non durable
6000 5200 4600 ‘90 ‘80 ‘85 One Cycle An Actual Business Cycle 1981 - 1990 ($ billion, 1992 dollars) Real GDP Peak Peak Trough 82
Global Depression, 1929-1932 Ave. Unemployment Rate, 1925-1928 Ave. Unemployment Rate, 1929-1933 Percent Decrease in Prices, 1929-1932
Six Million “Rosie the Riveters” • World War II Production of these items brought us out • of the Great Depression. • 300,000 warplanes • 124,000 ships • 289,000 combat vehicles and tanks • 36 billion yards of cotton goods • 41 billion rounds of ammunition • 2.4 million military trucks • 111,527 tank guns and howitzers • $288 billion was spent on the war, • $100 billion in the first six months. • Unemployment hit an all-time low of 1.2% • and personal savings were 25.5%.