Download
1 / 16
160 likes | 253 Views
Summer (June - Sept) IBIS GEE vs IBIS soil moisture r t 0-10cm 0.883 5.949 10-25cm 0.881 5.879 25-50cm 0.886 6.036 50-100cm 0.871 5.603 100-200cm 0.820 4.536 200-400cm 0.640 2.631 Summer (June - Sept) IBIS R vs IBIS soil moisture r t

E N D
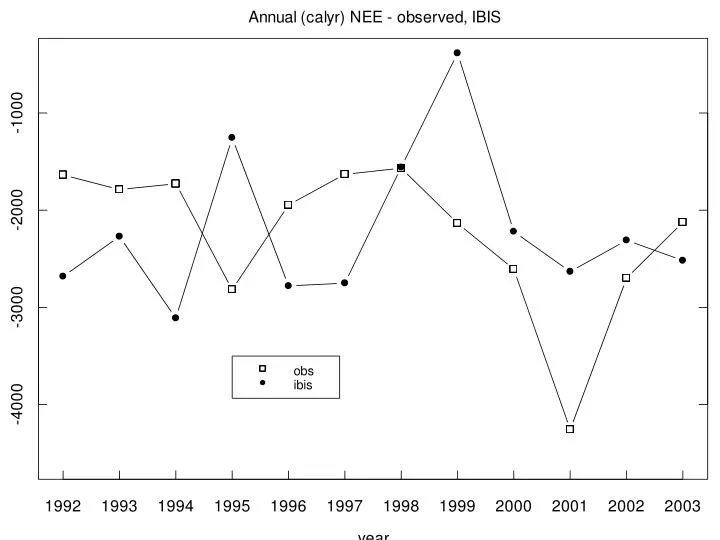
Summer (June - Sept) IBIS GEE vs IBIS soil moisture r t 0-10cm 0.883 5.949 10-25cm 0.881 5.879 25-50cm 0.886 6.036 50-100cm 0.871 5.603 100-200cm 0.820 4.536 200-400cm 0.640 2.631 Summer (June - Sept) IBIS R vs IBIS soil moisture r t 0-10cm 0.964 11.482 10-25cm 0.964 11.492 25-50cm 0.961 10.953 50-100cm 0.930 8.032 100-200cm 0.871 5.599 200-400cm 0.704 3.138 IBIS Summer GEE and R Are highly correlated with soil Moisture. The 2000-2004 jump in Summer GEE and R seems driven by soil mositure