Download
1 / 15
150 likes | 245 Views
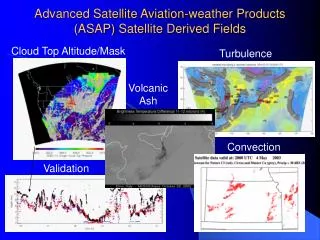
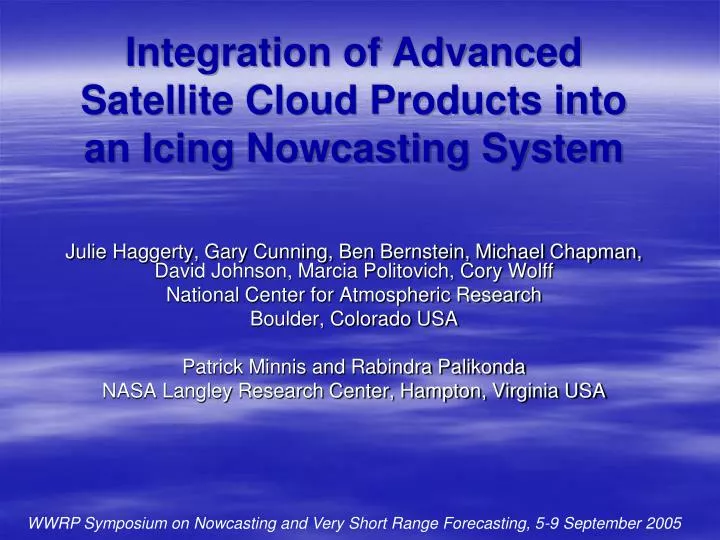
Integration of Advanced Satellite Cloud Products into an Icing Nowcasting System. Julie Haggerty, Gary Cunning, Ben Bernstein, Michael Chapman, David Johnson, Marcia Politovich, Cory Wolff National Center for Atmospheric Research Boulder, Colorado USA Patrick Minnis and Rabindra Palikonda

E N D
Integration of Advanced Satellite Cloud Products into an Icing Nowcasting System Julie Haggerty, Gary Cunning, Ben Bernstein, Michael Chapman, David Johnson, Marcia Politovich, Cory Wolff National Center for Atmospheric Research Boulder, Colorado USA Patrick Minnis and Rabindra Palikonda NASA Langley Research Center, Hampton, Virginia USA WWRP Symposium on Nowcasting and Very Short Range Forecasting, 5-9 September 2005
The NCARCurrent Icing Potential (CIP) System:A Basic Description Hourly diagnosis of icing potential and the potential for supercooled large drops over a three-dimensional domain over the continental United States Experimental version estimates icing severity Data sources include surface observations, pilot reports, model forecasts, radars, and lightning sensors Limited satellite data currently used (cloud mask and cloud top temperature) CIP Icing Potential at 825 mb 16 February 2005 at 1600 UTC
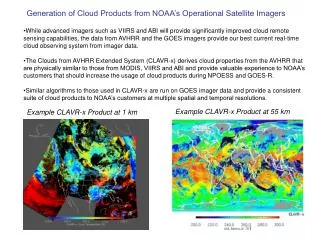
NASA Langley Satellite-derived Cloud Products • GOES Imager visible, near-infrared, and infrared channels • Products include cloud droplet phase, liquid water path, particle size • These variables can indicate possible icing conditions potential improvement to CIP products • Represent conditions primarily near cloud top Liquid water path at 1615 UTC on 16 February 2005 as derived from GOES-12 imagery.
Integration PlanCIP-Satellite Cloud Products • Forecasters’ experience using satellite products • Selection of satellite products likely to improve icing detection, i.e., phase, liquid water path, particle size • Objective assessment of satellite products • Modification of CIP algorithms to include satellite products • Case studies using modified version of CIP • Refinement of integration methods
Satellite Product Validation • Case studies – comparison of phase, LWP, cloud top height, particle size with research aircraft and ground-based radiometer data • Long-term intercomparison of satellite and CIP products with pilot reports • Statistical characterization of satellite products to verify forecasters’ guidelines
Satellite-Aircraft Comparisons from AIRS-II • Aircraft cloud-top penetrations • 13 aircraft-detected liquid cases • 10 classified correctly by satellite • 2 classified as ice (overlying cirrus?) • 1 as clear (varied conditions) • 2 aircraft-detected mixed phase cases • both classified as ice by satellite • 4 aircraft-detected ice cases • 3 classified correctly by satellite • 1 classified as clear
Comparison of Satellite Product with Ground-based Microwave Radiometer MWR Mean = 238.5 GOES Mean = 264.0 MWR Stddev = 156.6 GOES Stddev = 169.2 Correlation coefficient = 0.72
CIP Icing Severity Index • Severity product intended to characterize rate of ice accumulation • Current data sources are model estimates (vertical velocity, liquid water, temperature), pilot reports, and CIP icing potential • Good candidate for improvement by advanced satellite products because of liquid water and particle size dependence
Case StudiesNortheastern United States • Six cases identified with icing conditions and in situ measurements by a research aircraft • 16 February 2005; non-precipitating, single layer stratus cloud; cloud top temperature -10 to -15 ºC • 19 January 2005; widespread liquid cloud with high liquid water content; cloud top temperature -10 ºC
Adjustment of CIP Severity Index with Satellite Products Phase product locates pixels with liquid or supercooled liquid at cloud top Cloud drop phase, 16 February 2005, 1545 UTC
Adjustment of CIP Severity Index with Satellite Products LWP product assumed to represent liquid water content in highest cloud layer Liquid Water Path, 16 February 2005, 1545 UTC
Adjustment of CIP Severity Index with Satellite Products • Empirical scaling factor used to estimate liquid water content (LWC) in cloud layer using LWP estimate • New severity index calculated from LWC estimate for pixels with positive icing potential • Original CIP severity index adjusted upward or downward by half the difference
Areas of high LWP Modified by inclusion of satellite-derived phase and liquid water path products Original estimate CIP Icing Severity Index 16 February 2005 at 1600 UTC
CIP Icing Severity Index 19 January 2005 at 1915 UTC Modified by inclusion of satellite-derived phase and liquid water path products Original estimate
Interim Conclusions and Future Work • Advanced satellite products appear to have skill in estimating icing-related cloud variables • Integration of phase and LWP products for adjustment of CIP severity index produces results consistent with aircraft measurements • Analysis of additional, more complex cases • Refinement of integration methods and use of additional products such as particle size