Download
1 / 13
130 likes | 316 Views
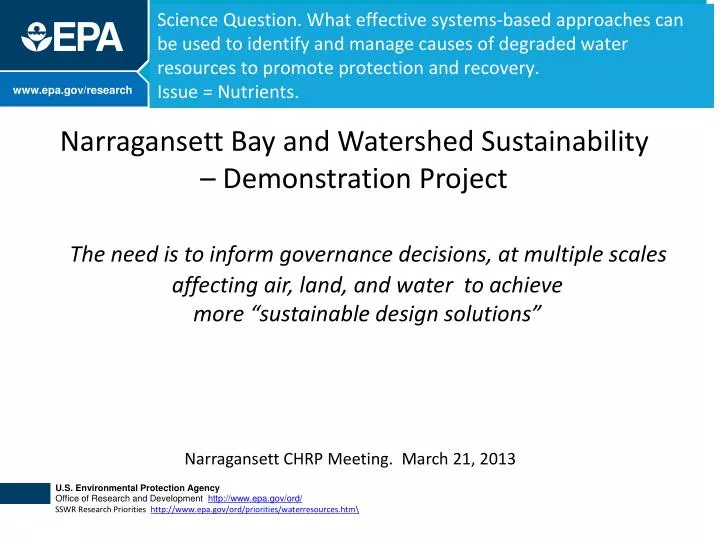
Science Question. What effective systems-based approaches can be used to identify and manage causes of degraded water resources to promote protection and recovery. Issue = Nutrients. Narragansett Bay and Watershed Sustainability – Demonstration Project .

E N D
Science Question. What effective systems-based approaches can be used to identify and manage causes of degraded water resources to promote protection and recovery. Issue = Nutrients. Narragansett Bay and Watershed Sustainability – Demonstration Project • The need is to inform governance decisions, at multiple scales affecting air, land, and water to achieve more “sustainable design solutions” Narragansett CHRP Meeting. March 21, 2013
Research Task and Products End Users Outcomes Key Research Outputs & Products • Boundary Partners = Key Governance Institutions that have the authority and capacity to influence the trajectory of ecosystem change • need improved, • data, information • knowledge delivery • to adjust policies • needed to achieve • more sustainable • systems solutions • contributing to • reduction in point • and non-point • sources of nutrients • & co-pollutants • affecting water • quality Trend analysis of stressors and ecological responses, particularly nutrients, in the Narragansett Bay Watershed Use of approaches in regulatory an non-regulatory decision making affecting future trajectory of ecosystem change Quantitative models describing past, current and future nutrient fluxes and associated ecosystem level responses in the Narragansett Bay watershed and estuary ecosystem Decision Support Applications to inform decisions affecting nutrient flux and possible changes to systems (e.g., ecosystems, communities, and economies) 2
15 SSWR – 6.1 To manage change, it is important to understand sources of nitrogen, and how these have changed over time. 5X ▲ TN Trends in Nitrogen Loading: Coterminous U.S.A. Compton et al. 2011 Ecology lettersAug;14(8):804-15. State of RI legislature embraced a goal of dramatically reducing landside nitrogen loading to the Bay 4X ▲ TN Narragansett Bay Vadeboncoeuret al. 2010 3
Atmospheric deposition of Nitrogen, (CMAQ model) How will NOx source control will affect Northeastern U.S. http://gispub4.epa.gov/LES/ 4
Blue area represent flow lines (NHDplus). SSWR 6.1 using 1:100K NHD to facilitate tech transfer http://gispub4.epa.gov/LES/ 5
Things accomplished already • Use and Refinement of Northeast SPARROW model TN and TP fluxes to characterize between variation in lake trophic status • Northeast Lakes Flex application for GIS map server and analysis • Doing additional GIS calculations related to cyanobacteria in lakes & reservoirs • Statements of issues and needs from key Boundary partners (OW, EPA R1, RI DEM, MA DEP) • Coordination with USGS. Some aspects could be scalable to Northeastern U.S. & subsequently used for U.S. East Coast in 2015 & beyond http://gispub4.epa.gov/LES/
EPA Narragansett Bay Modeling Hydrodynamics – FVCOM(Finite Volume Coastal Ocean Model) Point source reduction Future land use Climate change Shellfish restoration Shellfish Finfish Beaches Water Quality – WASP (Water Quality Analysis Simulation Program) Cumulative seagrass area Light Depth Ecology Models Blue area represents the potential seagrass area if its maximum depth was 3 meters. Modeling Seagrass extent
SCENARIOS Future land use Climate change (temp, precip, wind, SLR, OA) Shellfish restoration Point source reduction Photo: RI Emergency Management Agency Photo: The Nature Conservancy in RI Source: RIDEM We are using the USGS SPARROW model for nutrient loading to the Bay – SPARROW models only total nitrogen (TN) and total phosphorus (TP), and gives only annual loads.
FVCOM (Finite Volume Coastal Ocean Model) - Hydrodynamics Executed with two modeling setups: EFDC (short-term) and FVCOM (Longer-term) Residence times, circulation patterns (collapsed in time/space)
EPA’s WASP Water Quality Model RIDEM Fish seine stations WASP can model individual nutrient species and multiple phytoplankton groups Models are integrated with available data NH3, DO, chl a, TSS www.epa.gov/athens/wwqtsc/html/wasp.html
Seagrass Modeling Depth of Colonization Objective Potential Seagrass Habitat Chlorophyll-a CDOM Particulates TN, TP Loading TN, TP Conc. Inputs from Watershed Cumulative seagrass area Water Quality Affecting Optical Properties Light Depth The relationship between nutrient inputs (N) and light quality/quantity for the seagrass Zostera marina – mediated through the relationship between N and chl a (phytoplankton) – is being developed. Blue area represents the potential seagrass area if its maximum depth was 3 meters.
Using a food web-based model to examine the response to nutrient inputs effect of shellfish on nitrogen • We are developing: 1) stressor-response relationships between eutrophication measures (nutrient load/DO) and benthic condition, and 2) population models for fish and shellfish
Working with Model Results • Valuation of shellfish, finfish, and beaches • Can we develop a formal application of existing data to quantify uncertainty and compare the trade-offs between bias and variance among models? We are examining information-theoretic inference and bayesian techniques. Narragansett Beach: 100 visitors/day x $49/visit (parking, food, other) = $49,000