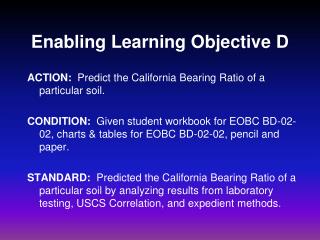
Enabling Learning Objective C
Enabling Learning Objective C. ACTION: Analyze soil classification test results CONDITION: Given student workbook for EOBC BD-02-02, charts and tables for EOBC BD-02-02, laboratory and field data for a particular soil, pencil and paper.

Enabling Learning Objective C
E N D
Presentation Transcript
Enabling Learning Objective C ACTION: Analyze soil classification test results CONDITION: Given student workbook for EOBC BD-02-02, charts and tables for EOBC BD-02-02, laboratory and field data for a particular soil, pencil and paper. STANDARD: Analyzed soil classification test results to include: test results from laboratory testing procedures and test results from field testing procedures and verified that the proper USCS classification has been determined.
Objective of Soil Classification “To predict the engineering properties and behavior of a soil based on laboratory and field data”. Pg 15 Workbook
Properties Determining USCS Symbols 1) % Gravels, % Sands and % Fines. 2) Gradation of the gravels and sands. 3) Plasticity and or Compressibility of the fines. Pg 15 Workbook
USCS Symbols for Gravel (G) GW – Gravel, well graded GP – Gravel, poorly graded GM – Gravel, silty (or silty gravel) GC – Gravel, clayey (or clayey gravel) Pg 16 Workbook
USCS Symbols for Sand (S) SW – Sand, well graded SP – Sand, poorly graded SM – Sand, silty (or silty sand) SC – Sand, clayey (or clayey sand) Pg 16 Workbook
USCS Symbols for Silts (M) ML – Silt, low plasticity MH – Silt, high plasticity Pg 16 Workbook
USCS Symbols for Clays (C) CL – Clay, low plasticity CH – Clay, high plasticity Pg 16 Workbook
USCS Symbols for Organics (O) OL – Organic, low plasticity OH – Organic, high plasticity Pg 16 Workbook
Determine % of gravels, sands and fines 3” Sieve Gravels #4 Sieve Sands #200 Pan Fines Testing Sieves Hand-operated Shaker
Gradation The distribution of particle sizes in a soil. Poorly Graded Well Graded Pg 17 Workbook
Bravo Airfield 01 May 02 SIZE (Inches) SIEVE NUMBER PERCENT PASSING % RETAINED GRAIN SIZE IN MM LL PL PI Cu Cc G =____%, S =____%, F = ___% 1 + 00 1A 27 12 15 Pg 19 Workbook
Bravo Airfield 01 May 02 1 + 00 1A 27 12 15 Pg 19 Workbook
100 - 79 21% Gravel Sand 100 - (21 + 4.5) = ? 79 4.5% Fines 4.5 Bravo Airfield 01 May 02 74.5 % Sand 1 + 00 1A 27 12 15 G = 21% , S = 74.5% , F = 4.5% ? S
Whichever is present in greatest amount in percent by weight SAND (S) or GRAVEL (G) GW GW-GM SW-SM ClassificationProcedure Chart Bravo Airfield ANY SOIL Fibrous Organic Peat or Muck Pt < 50% Fines > 50% Fines Course Grained Fine Grained (Plasticity Chart) (Sieve Analysis) BELOW A-LINE -- SILT (M) ABOVE A-LINE -- CLAY (C) COLOR & ODOR -- ORGANIC (O) (Value of Liquid Limit) (Percent & Plasticity of Fines) 5% - 12% Fines < 5% Fines 13% - 50% LL < 50 LL > 50 Fines any type GW SW GW SW High Low Cu > 4 > 6 Cu > 4 > 6 Type of Fines, Compressibility Compressibility Cc 1-3 1-3 Cc 1-3 1-3 Plasticity Chart Gradation and Gradation Only MH GM Types of Fines ML CH GM-GC ML-CL OH GC CL GP GP-GM SP-SM SM OL GW-GC SW-SC SW SM-SC SP SC Pg 5 C&T GP-GC SP-SC
(PERCENT & PLASTICITY OF FINES) < 5% FINES 5% - 12% FINES > 12% - < 50% FINES ANY TYPE GW GW SW SW Cu Cu > 6 > 6 > 4 > 4 Cc Cc 1 - 3 1 - 3 1 - 3 1 - 3 CLASSIFICATIONPROCEDURE X If the soil does not meet BOTH the Cu & Cc factors then it is an SP TYPE OF FINES, PLASTICITY CHART GM GM-GC GC SM SM-SC SC (GRADATION AND TYPE OF FINES) GW-GM SW-SM GP-GM SP-SM GW-GC SW-SC GP-GC SP-SC (GRADATION ONLY) GW GP SW SP X X Pg 5 C&T
Coefficient of Curvature Another quantity that may be used to judge the gradation of a soil is the coefficient of curvature, designated by the symbol (Cc). (D30)2 (D60 x D10) Cc = Coefficient of Uniformity The ratio between the grain diameter (in millimeters) corresponding to 60 % passing on the curve (D60) divided by the diameter of the 10 % (D10) grain size passing. D60 Cu = D10 Pg 17 Workbook
D60 Criteria D30 Criteria D10 Criteria Bravo Airfield 01 May 02 1 + 00 1A 27 12 15 S G = 21% , S = 74.5% , F = 4.5% Pg 20 Workbook
1 + 00 1A 27 12 15 S G = 21% , S = 74.5% , F = 4.5% Bravo Airfield 01 May 02 Cu = 2.5 0.12 = 20.83 Cc = (0.24)2 (2.5 x 0.12) = 0.192 0.24mm 2.5mm 0.12mm 2.5 0.12 = 20.83 .242 (2.5x0.12) = 0.192
(PERCENT & PLASTICITY OF FINES) < 5% FINES 5% - 12% FINES > 12% - < 50% FINES ANY TYPE GW GW SW SW Cu Cu > 6 > 6 > 4 > 4 Cc Cc 1 - 3 1 - 3 1 - 3 1 - 3 CLASSIFICATIONPROCEDURE X If the soil does not meet BOTH the Cu & Cc factors then it is an SP TYPE OF FINES, PLASTICITY CHART GM GM-GC GC SM SM-SC SC (GRADATION AND TYPE OF FINES) GW-GM SW-SM GP-GM SP-SM GW-GC SW-SC GP-GC SP-SC (GRADATION ONLY) GW GP SW SP X X X Pg 5 C&T
P Bravo Airfield 01 May 02 What if the percentage of Fines is greater than 5%? 2.5 0.12 = 20.83 1 + 00 1A 27 12 15 .242 (2.5x0.12) = 0.192 S G = 21% , S = 74.5% , F = 4.5% Pg 20 Workbook
Atterberg Limits Determines the Plasticity and or Compressibility of the fines. Liquid Limit - The (LL) is the minimum moisture content at which a soil will flow with the application of a very small shearing force. With only a small amount of energy input, the soil will flow under its own weight. Plastic Limit - The (PL) is arbitrarily defined as the lowest moisture content at which a soil can be rolled into a thread 1/8” inch in diameter without crushing or breaking. Plasticity Index - The (PI) of a soil is the numerical difference between the LL and the PL. PI = LL - PL
DD Form 1209 (Atterberg Limits Determination) Top of form determines Liquid Limit (LL) Bottom of form determines Plastic Limit (PL) LL & PL lab results will be given, you must determine Plasticity Index using these results. LL – PL = PI Atterberg Limits
A Line 40 LOW LL Liquid Limit < 50 HIGH LL Liquid Limit > 50 30 CLAYS SILTS 20 ML & OL MH & OH 10 U Line PLASTICITY CHART (to determine C or M) CH PLASTICITY INDEX, PI CL CL-ML 0 40 50 30 60 10 20 70 LIQUID LIMIT, LL Pg 6 C&T
20 66 18 16 In Class Practical Exercise #1 01 May 02 18% Gravel 66% Sands 16% Fines S 2 + 50 2A 36 16 G = _____% , S = ____% , F = _____% Pg 21 Workbook
GW GW SW SW Cu Cu > 6 > 6 > 4 > 4 Cc Cc 1 - 3 1 - 3 1 - 3 1 - 3 X X X CLASSIFICATIONPROCEDURE In Class Practical Exercise #1 (PERCENT & PLASTICITY OF FINES) < 5% FINES 5% - 12% FINES > 12% - < 50% FINES ANY TYPE TYPE OF FINES, PLASTICITY CHART GM GM-GC GC SM SM-SC SC (GRADATION AND TYPE OF FINES) GW-GM SW-SM GP-GM SP-SM GW-GC SW-SC GP-GC SP-SC (GRADATION ONLY) GW GP SW SP Eliminate Gravel classification M or C??? Go to Plasticity Chart Pg 5 C&T
40 30 CL 10 PLASTICITY CHART CH LOW COMPRESSIBLE Liquid Limit < 50 HIGH COMPRESSIBLE Liquid Limit > 50 CLAYS PLASTICITY INDEX, PI SILTS 20 MH & OH ML & OL CL-ML 0 36 40 50 30 60 10 20 70 LIQUID LIMIT, LL Pg 6 C&T
GW GW SW SW Cu Cu > 6 > 6 > 4 > 4 Cc Cc 1 - 3 1 - 3 1 - 3 1 - 3 X X X X X CLASSIFICATIONPROCEDURE In Class Practical Exercise #1 (PERCENT & PLASTICITY OF FINES) < 5% FINES 5% - 12% FINES > 12% - < 50% FINES ANY TYPE TYPE OF FINES, PLASTICITY CHART GM GM-GC GC SM SM-SC SC (GRADATION AND TYPE OF FINES) GW-GM SW-SM GP-GM SP-SM GW-GC SW-SC GP-GC SP-SC (GRADATION ONLY) GW GP SW SP Plasticity Chart classifies as CL Pg 5 C&T
20 66 18 16 N/A N/A In Class Practical Exercise #1 01 May 02 18% Gravel Any Questions??? 66% Sands 16% Fines C S 2 + 50 2A 36 16 G = _____% , S = ____% , F = _____% Pg 21 Workbook
In Class Practical Exercise #2 01 May 02 Work PE #2 on your own. 3 +50 3B 28 16 G = _____%, S = ____%, F = ____% Pg 22 Workbook
In Class Practical Exercise #2 01 May 02 44% Gravel 47% Sand 9% Fines 12 44 47 9 3 +50 3B 28 16 S? G = _____%, S = ____%, F = ____% Pg 22 Workbook
Whichever is present in greatest amount in percent by weight SAND (S) or GRAVEL (G) GW GW-GM SW-SM ClassificationProcedure Chart In Class Practical Exercise #2 ANY SOIL Fibrous Organic Peat or Muck Pt < 50% Fines > 50% Fines Course Grained Fine Grained (Plasticity Chart) (Sieve Analysis) BELOW A-LINE -- SILT (M) ABOVE A-LINE -- CLAY (C) COLOR & ODOR -- ORGANIC (O) (Value of Liquid Limit) (Percent & Plasticity of Fines) 5% - 12% Fines < 5% Fines 13% - 50% LL < 50 LL > 50 Fines any type GW SW GW SW High Low Cu > 4 > 6 Cu > 4 > 6 Type of Fines, Compressibility Compressibility Cc 1-3 1-3 Cc 1-3 1-3 Plasticity Chart Gradation and Gradation Only MH GM Types of Fines ML CH GM-GC ML-CL OH GC CL GP GP-GM SP-SM SM OL GW-GC SW-SC SW SM-SC SP SC GP-GC SP-SC Pg 5 C&T
GW GW SW SW Cu Cu > 6 > 6 > 4 > 4 Cc Cc 1 - 3 1 - 3 1 - 3 1 - 3 CLASSIFICATIONPROCEDURE In Class Practical Exercise #2 (PERCENT & PLASTICITY OF FINES) < 5% FINES 5% - 12% FINES > 12% - < 50% FINES ANY TYPE X TYPE OF FINES, PLASTICITY CHART GM GM-GC GC SM SM-SC SC (GRADATION AND TYPE OF FINES) GW-GM SW-SM GP-GM SP-SM GW-GC SW-SC GP-GC SP-SC (GRADATION ONLY) GW GP SW SP Is it well graded or poorly graded? Pg 5 C&T
Cu = 7.8 0.081 = 96.3 Cc = 0.812 (7.8 x 0.081) = 1.04 7.8 0.081 0.81 96.3 1.04 In Class Practical Exercise #2 01 May 02 12 44 47 9 3 +50 3B 28 16 S G = _____%, S = ____%, F = ____% Pg 22 Workbook
CU = 96.3 GW GW SW SW Cu Cu > 6 > 6 > 4 > 4 Cc Cc 1 - 3 1 - 3 1 - 3 1 - 3 CU = 1.04 CLASSIFICATIONPROCEDURE In Class Practical Exercise #2 (PERCENT & PLASTICITY OF FINES) < 5% FINES 5% - 12% FINES > 12% - < 50% FINES ANY TYPE X SW TYPE OF FINES, PLASTICITY CHART GM GM-GC GC SM SM-SC SC (GRADATION AND TYPE OF FINES) GW-GM SW - SM GP-GM SP - SM GW-GC SW - SC GP-GC SP - SC (GRADATION ONLY) GW GP SW SP X X Pg 5 C&T
40 30 20 10 PI=12 LL=28 LL = 28 PL = 16 PI = 12 PLASTICITY CHART CH LOW LL Liquid Limit < 50 HIGH LL Liquid Limit > 50 CLAYS PLASTICITY INDEX, PI SILTS CL MH & OH ML & OL CL-ML 0 40 50 30 60 10 20 70 LIQUID LIMIT, LL Pg 6 C&T
7.8 0.081 0.81 In Class Practical Exercise #2 01 May 02 S W - S M or SW - SC? 44 47 9 3 +50 3B 28 16 SW - SC 12 96.3 1.04 G = _____%, S = ____%, F = ____% Pg 22 Workbook
Midpoint Review Classify soil using the USCS • Discussed the properties of soil • Identified the USCS symbols • Classified soil using the USCS • Determine percent of G, S, & F using grain size distribution graph • Used classification procedure chart on pg 5 of charts & tables • Used plasticity chart on page 6 of charts & tables Questions?
Check on Learning Q: The % of gravel is the amount of material retained on which sieve number? A: The number 4 sieve. Q: The % of fines is the amount of material passing which sieve? A: The number 200 sieve. Q: Determining your CU & CC will identify if the soil is what? A: Either well graded or poorly graded. Q: Which chart must you refer to to determine if your soil is clay or silt and high or low plasticity? A: Plasticity Chart (PG 6 Charts and Tables)
Soil Classification by the Field Method Pg 23 Workbook
Visual Examination Test • Separate all ¼ inch and larger material by hand or run material through the number 4 sieve • Place ¼ inch and larger material next to ¼ inch and smaller material • Estimate percent of gravel • Note color • Note grain size • Note grain shape Pg 23 Workbook
Sedimentation Test • Place 1 inch of material minus the gravel into a jar • Mark level of material on jar • Add water to within 1-2 inch to top and cover • Shake vigorously for 4-5 minutes • Place jar on level surface and note time • After 30 seconds have passed, notice the heavier sands have begun to settle, mark level of sands on jar. • Estimate percent of sands in jar • Multiply percent of sand in jar by 100 percent minus the gravel %S = % settled(100-%G) Pg 24 Workbook
Odor Test • Heat the sample with a match or open flame • Foul smell – organics present • Always perform this test before the bite or grit test Pg 23 Workbook
Dry Strength Test • Form a moist pat 2 inches in diameter by ½ inch thick • Dry with low heat • Attempt to break pat with thumb and forefinger • Breakage easy – ML • Breakage difficult – CL or MH • Breakage impossible – CH Pg 23 Workbook
Powder Test • Rub portion of broken pat with thumb and attempt to flake off particles • If pat powders – M • If not – C Pg 23 Workbook
Feel Test • Rub a portion of dry soil over a sensitive portion of the skin • Harsh feeling – ML or S • Smooth feeling – C Pg 23 Workbook
Shine Test • Draw a smooth surface over a pat of moist soil • Surface becomes shiny- CH • Remains dull – CL • Very dull or granular – M or S Pg 23 Workbook
Roll/Thread Test • Form a ball of moist soil (Marble Size) • Attempt to roll ball into 1/8 inch thread • Easily obtained – C • Cannot be obtained - M Pg 23 Workbook
Ribbon Test • Form a cigar shape with the soil • Flatten the shape with forefinger and thumb, attempting to form a ribbon 8 to 9 inches long, ¼ inch thick, and 1 inch wide • Ribbon obtained – CH • Less than 8 inch obtained – CL • No ribbon obtained – ML Pg 23 Workbook
Grit or Bite Test • Place a pinch of the sample between the teeth and bite • Gritty – ML or S • Floury - C Pg 23 Workbook
Wet-Shaking Test • Place pat of moist soil in hand • Shake hand vigorously and strike it against the other hand • Observe how rapidly water rises to the surface • Rises fast – M • No reaction – C Pg 23 Workbook