Download
1 / 17
170 likes | 303 Views
E nergy in Queensland through the eyes of its users: observations and questions. Presentation to the EUAA Queensland Energy Forum Stamford Plaza Hotel 17 April 2013. Bruce Mountain Director. Outline. Retail electricity prices . Wholesale markets. Gas. Renewables. Networks.

E N D
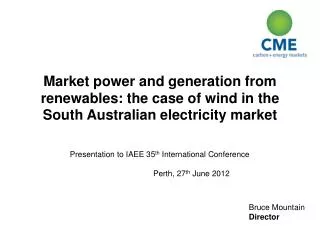
Energy in Queensland through the eyes of its users: observations and questions Presentation to the EUAA Queensland Energy Forum Stamford Plaza Hotel 17 April 2013 Bruce Mountain Director
Outline Retail electricity prices Wholesale markets Gas Renewables Networks
Retail electricity prices have increased sharply over the last five years Queensland doing better than national average – Government residential tariff prize freeze in 2012 Index of change in prices to business users not available. Price changes to individual users affected by tariff structure changes and many other factors Source: ABS data, CME analysis.
And further significant increases are expected from July • QCA Draft Decision: • Typical household tariff up 21.4% (~ half is catch-up for price last price freeze) • Small non-household tariffs up 12% to 16% • Increases to large and very large users up 10% • AEMC Electricity Price Trends Report • retail prices in Queensland up 4% p.a. between 1 July 2012 and 30 June 2015 - but QCA has recommended increase of 21.4% in 2013 alone
Wholesale: Queensland spot prices have tracked those in the rest of the NEM Demand-weighted average spot prices
Annual peak (NEM) demand is barely unchanged over the last 6 years and average demand has been slowly declining
And spot prices in Queensland have risen more than in other NEM regions What will a change of federal government mean for emission prices and hence wholesale electricity prices?
But since emission prices have been introduced, Queensland spot prices have more than doubled over the previous period
Mandatory renewables obligations have added significantly to retail prices recently LRET collected ~ $700m in 2012 and expected ~ $800m in 2013, from end users. Average charge per user in 2013: around $4/MWh. Will renewables developers be able to ramp up capacity at the rate needed to meet the target ? SRES collected around $1.8bn in 2012 and can be expected to collect around $1.4bn in 2013, from end users. Average charge per user in 2013: around $8/MWh. Will STC creation decline as the Government expects?
Residential PV expansion accounts for much of the SRES subsidy • Installed capacity at April 2013 greater than 2.4 GW. • More than 1 million installations. • Queensland has about 30% market share – almost twice as much as next highest state. • With feed-in tariff subsidies cut and the STC multiplier terminated, what rate will the PV grow in future? Source: Clean Energy Regulator
The recent Beach – Origin gas deal sets a benchmark for future gas prices in Queensland • Australian LNG producers: same incentive as domestic gas consumers – source Australian gas as cheaply as possible • Beach-Origin contract is first major deal by a party not involved in Gladstone LNG projects. • Gas sourced from Beach’s 20% share in Cooper Basin Joint Venture. Queensland LNG is now also exporting Cooper Basin’s conventional gas ! • 139PJ over 8 years starting after July 2014. Options to extend for two years and 37 PJ. Enough to meet about 60% of Queensland domestic gas demand for 1 year – or one APLNG train for 7 months. • Pricing is not publicly available, but is linked to oil prices “and other parameters”. Carbon is a pass-through. Speculation is $8-9/GJ ex Moomba. Not good news for Queensland gas users. What will follow?
Queensland network price outcomes: not a pretty picture Distributor revenue per customer consistently higher in Queensland than other NEM regions, but the gap has grown very large Powerlink transmission revenue per MWh grown significantly, but stabilises from 2014.
Expansion of the regulated asset base is the main reason for higher prices In 2014 Queensland distributors will have about 3.5 as much capital per connection as Victorian distributors In 2014, Powerlinkwill have 2.5 times as much capital per MW of demand as in Victoria
The Independent Review Panel’s Interim Report is an indictment on the ownership and regulation of networks in Queensland • “The Panel’s analysis, supported by .. findings of the Energy Users Association of Australia … privately owned DNSPs in Victoria and South Australia … consistently more efficient than the Government-owned DNSPs in Queensland and New South Wales”. • “ … Government owned entities are much less responsive to regulatory incentives due to less constrained access to capital and because the strict commercial charter that should apply under corporatisation is often compromised by the collateral social and economic objectives of Government”. • “ … Government should give consideration to the privatisation of the DNSPs”.
And the Panel has concluded big savings can be achieved • … cumulative reductions in total expenditure of around $3.6 billion in current 5-year regulatory period • … further $1.4 billion (saving)in indirect costs … over the five years from the end of their (current) regulatory periods. • In summary .., savings of at least $5.0 billion in the period to 2019/20. With network prices fixed for the five year period, how will energy users obtain the benefit of these savings ?
And so, what should users do? • Reduce energy consumption wherever you can: a dollar saved is worth much more than a dollar earned. • Where possible produce to meet your own needs, if it pays off. • In procurement, smarts will take you far. Knowledge is power. • Get the ear of senior management in your businesses. • Users have been losers, for a long time. Get involved. Work together where you can. Get your facts straight and state your case plainly but fairly. • Stick at it.
Contact details Bruce Mountain Director, CME Level 43, 80 Collins Street Melbourne 3000. 0405 505 060 03 9664 0680