Download
1 / 12
130 likes | 298 Views
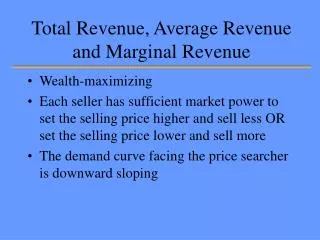
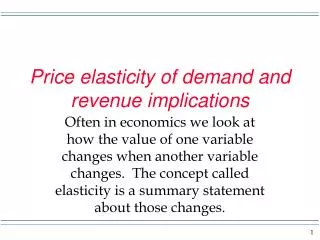
Own price elasticity and total revenue changes. Total revenue (TR) is price times quantity. Along the demand curve P and Q move in opposite directions. Knowledge of Ed assists in knowing how TR will change. Elasticity and total revenue relationship.

E N D
Own price elasticity and total revenue changes Total revenue (TR) is price times quantity. Along the demand curve P and Q move in opposite directions. Knowledge of Ed assists in knowing how TR will change.
Elasticity and total revenue relationship When we look at the collection of consumers in the market, at this time in our study we assume each consumer pays the same price per unit for the product. Also at this time in our study the total expenditure of the consumers in the market would equal the total revenue (TR) to the sellers. So, here we look at the whole demand side of the market in general.
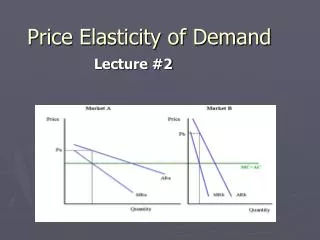
Elasticity and total revenue relationship P TR in the market is equal to the price in the market multiplied by the quantity traded in the market. In this diagram TR equals the area of the rectangle made by P1, Q1 and P1 Q Q1 the horizontal and vertical axes. We know from math that the area of a rectangle is base times height and thus here that means P times Q.
Elasticity and total revenue relationship We will want to look at the change in values of a variable and in order to do so we want to have a consistent measure of change. In this regard let’s say the change in a variable is the later value minus the earlier value. Thus if the price should change from P1 to P2, then the change in price is P2 - P1, or similarly if the TR should change the change in TR is TR2 - TR1.
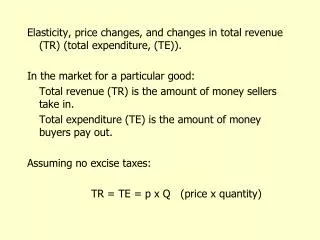
Elasticity and total revenue relationship P Now in this graph when the price is P1 the TR = a + b(adding areas) and if the price is P2 the TR = b + c. The change in TR if the price should fall P1 P2 a b c Q Q1 Q2 from P1 to P2 is (b + c) - (a + b) = c - a. Similarly, if the price should rise from P2 to P1 the change in TR is a - c. I will focus on price declines next.
Elasticity and total revenue relationship P Since the change in TR is c - a, the value of the change will depend on whether c is bigger or smaller, or even equal to, a. In this diagram we see c > a and thus the change in TR > 0. P1 P2 a b c Q Q1 Q2 This means that as the price falls, TR rises. I think you will recall that in the upper left of the demand the demand is price elastic. Thus if the price falls in the elastic range of demand TR rises.
Elasticity and TR You will note on the previous screen that I had c - a. In the graph c is indicating the change in TR because we are selling more units. The area a is indicating the change in TR when there is a price change. We have to bring the two together to get the change in TR. Thus a lower price has a good and a bad. Good - sell more units. Bad - sell at lower price.
Elasticity and total revenue relationship P Now in this graph when the price is P1 the TR = a + b(adding areas) and if the price is P2 the TR = b + c. In this diagram we see c < a and thus the change in TR < 0. P1 P2 a b c Q Q1 Q2 I think you will recall that in the lower right of the demand the demand is price inelastic. Thus if the price falls in the inelastic range of demand TR falls.
Elasticity and total revenue relationship P Now in this graph when the price is P1 the TR = a + b(adding areas) and if the price is P2 the TR = b + c. In this diagram we see c = a and thus the change in TR = 0. P1 P2 a b c Q Q1 Q2 I think you will recall that in the middle of the demand the demand is unit elastic. Thus if the price falls in the unit elastic range of demand TR does not change.
Marginal revenue Marginal revenue is defined as the change in total revenue as the number of units cold changes. In the demand graph we have seen that in order to sell more the price has to be lowered. So, there is a relationship between elasticity and marginal revenue. If price falls and demand is elastic we know TR rises so MR is positive. If Price falls and demand is inelastic we know TR falls and so MR is negative. If price fall and demand is unit elastic we know TR does not change.
formula • The relationship between elasticity and marginal revenue is • MR = P{(1 + Ed)/Ed}. Price is a positive amount, Ed is a negative amount. Let’s take some examples. • Ed = -2 (demand is elastic), then MR = P(-1/-2) = .5P ( a positive number) and so MR > 0 and MR < P. • Ed = -1 (demand is unit elastic), then MR = 0 and MR < P. • Ed = -.5 (demand is inelastic), then MR = P(.5/-.5) = -1P (a negative number) and MR < P.
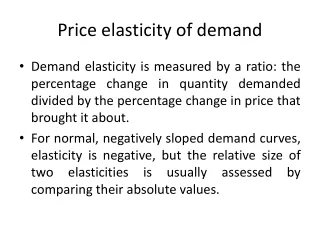
Elasticity and MR P Elastic range Unit elastic Inelastic range D Q MR