Download

1 / 18
180 likes | 329 Views
6.5 – Translation of Sine and Cosine Functions. Phase Shift. A horizontal translation or shift of a trigonometric function y = Asin(k θ – c) or y = Acos(k θ – c) The phase shift is c/k, where k > 0 If c < 0, shifts to the left If c > 0, shifts to the right.

E N D
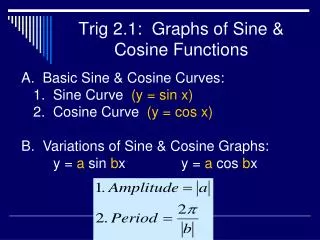
Phase Shift • A horizontal translation or shift of a trigonometric function • y = Asin(kθ – c) or y = Acos(kθ – c) The phase shift is c/k, where k > 0 If c < 0, shifts to the left If c > 0, shifts to the right
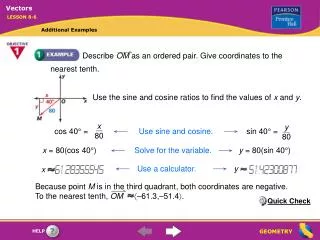
State the phase shift for each function. Then graph the function. • y = cos(θ + π) • y = sin(4θ – π)
Midline • A horizontal axis that is the reference line or the equilibrium point about which the graph oscillates. • It is in the middle of the maximum and minimum. • y = Asin(kθ – c) + h or y = Acos(kθ – c) + h The midline is y = h If h < 0, the graph shifts down If h > 0, the graph shifts up
State the vertical shift and the equation for the midline of each function. Then graph the function. 1. y = 3sinθ + 2
Putting it all together! • Determine the vertical shift and graph the midline. • Determine the amplitude. Dash lines where they are located. • Determine the period and draw a dashed graph of the sine or cosine curve. • Determine the phase shift and translate your dashed graph to draw the final graph.
6.6 – Modeling Real World Data with Sinusoidal Functions • Representing data with a sine function
How can you write a sin function given a set of data? • Find the amplitude, “A”: (max – min)/2 • Find the vertical translation, “h”: (max + min)/2 • Find “k”: Solve 2π/k = Period • Substitute any point to solve for “c”
Write a sinusoidal function for the number of daylight hours in Brownsville, Texas.
1. Find the amplitude Max = 13.75 Min = 10.53 (13.75 – 10.53)/2 = 1.61
2. Find “h” Max = 13.75 Min = 10.53 (13.75 + 10.53)/2 = 12.14
3. Find “k” Period = 12 2π = 12 k 2π = 12k π/6 = k
4. Substitute to find “c” y = Asin(kθ – c) + h y = 1.61sin(π/6 t – c) + 12.14 10.68 = 1.61sin(π/6 (1) – c) + 12.14 -1.46 = 1.61sin(π/6 – c) sin-1(-1.46/1.61) = π/6 – c 1.659… = c
5. Write the function y = 1.61sin(π/6t – 1.66) + 12.14
Homework Help • Frequency – the number of cycles per unit of time; used in music • Unit of Frequency is hertz • Frequency = 1/Period • Period and Frequency are reciprocals of each other.
Assignment Guide Changes • Today’s work: 6.5 p383 #15 – 24 (x3) – now draw the graphs 6.6 p391 #7-8, 13, 22-23 • Quiz on Wednesday over 6.3 – 6.5