Download
1 / 21
220 likes | 344 Views
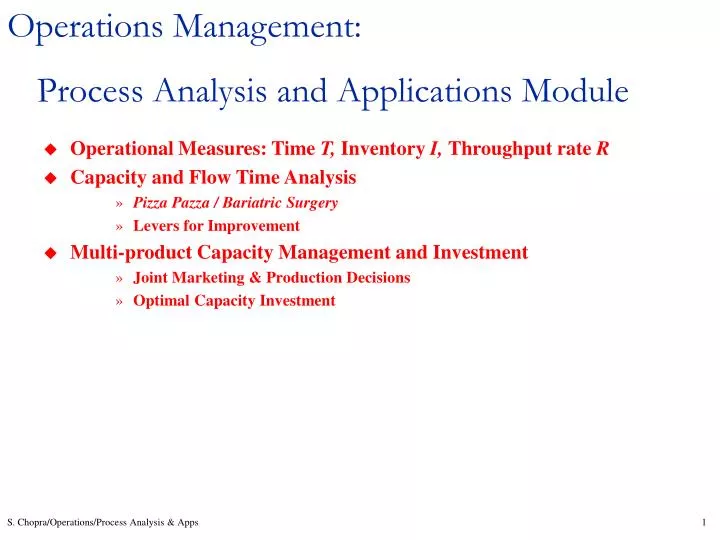
Operations Management: Process Analysis and Applications Module. Operational Measures: Time T, Inventory I, Throughput rate R Capacity and Flow Time Analysis Pizza Pazza / Bariatric Surgery Levers for Improvement Multi-product Capacity Management and Investment

E N D
Operations Management: Process Analysis and Applications Module • Operational Measures: Time T, Inventory I, Throughput rate R • Capacity and Flow Time Analysis • Pizza Pazza / Bariatric Surgery • Levers for Improvement • Multi-product Capacity Management and Investment • Joint Marketing & Production Decisions • Optimal Capacity Investment S. Chopra/Operations/Process Analysis & Apps
Operational Performance Measures • How to measure and decrease flow times? • How to measure and increase throughput? S. Chopra/Operations/Process Analysis & Apps
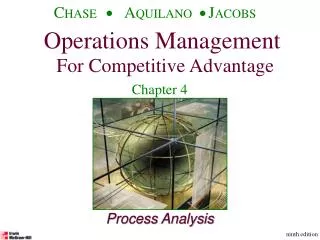
Process Architecture is defined and represented by a process flow chart: Process = network of activities performed by resources 1. Process Boundaries: • input • output 2. Flow unit: the unit of analysis 3. Network of Activities & Storage/Buffers • activities with activity times • routes: precedence relationships (solid lines) 4. Resources & Allocation 5. Information Structure & flow (dashed lines) S. Chopra/Operations/Process Analysis & Apps
Pizza Pazza Flow Chart S. Chopra/Operations/Process Analysis & Apps
Operational Measure: Flow Time Driver: Activity Times • (Theoretical) Flow Time • Critical Activity • Flow Time efficiency S. Chopra/Operations/Process Analysis & Apps
Most time inefficiency comes from waiting:E.g.: Flow Times in White Collar Processes S. Chopra/Operations/Process Analysis & Apps
Levers for Reducing Flow Time • Decrease the work content of critical activities • work smarter • work faster • do it right the first time • change product mix • Move work content from critical to non-critical activities • to non-critical path or to ``outer loop’’ • Reduce waiting time. S. Chopra/Operations/Process Analysis & Apps
Operational Measure: Capacity Drivers: Resource Loads • (Theoretical) Capacity of a Resource • Bottleneck Resource • (Theoretical) Capacity of the Process • Capacity Utilization of a Resource/Process = throughput [units/hr] capacity [units/hr] S. Chopra/Operations/Process Analysis & Apps
A Recipe for Capacity Measurements * assuming system is processing at full capacity S. Chopra/Operations/Process Analysis & Apps
Bariatric Surgery : Flow Chart S. Chopra/Operations/Process Analysis & Apps
Bariatric Clinic Capacity – Open Surgeries & Cash Payment S. Chopra/Operations/Process Analysis & Apps
Bariatric Clinic Capacity – Laparoscopic Surgeries & Cash Payment S. Chopra/Operations/Process Analysis & Apps
Bariatric Clinic Capacity – Open Surgeries & Insurance Payment S. Chopra/Operations/Process Analysis & Apps
Bariatric Clinic Capacity – Laparoscopic Surgeries & Insurance Payment S. Chopra/Operations/Process Analysis & Apps
Levers for Increasing Process Capacity • Decrease the work content of bottleneck activities • work smarter, work faster • do it right the first time • eliminate non-value added work from bottlenecks • reduce/eliminate setups and changeovers • synchronize flows to & from bottleneck • reduce starvation & blockage • Move work content from bottlenecks to non-bottlenecks • to non-critical resource or to third party • Increase Net Availability • work longer • increase scale (invest) • increase size of load batches • eliminate availability waste S. Chopra/Operations/Process Analysis & Apps
Increasing Process Capacity in The Goal • “is to increase the capacity of only the bottlenecks” • “ensure the bottlenecks’ time is not wasted” • increase availability of bottleneck resources • eliminate non-value added work from bottlenecks • reduce/eliminate setups and changeovers • synchronize flows to & from bottleneck • reduce starvation & blockage • “ the load of the bottlenecks (give it to non-bottlenecks)” • move work from bottlenecks to non-bottlenecks • need resource flexibility • unit capacity and/or #of units. • invest S. Chopra/Operations/Process Analysis & Apps
Other factors affecting Process Capacity • Batch (Order) Sizes • Product Mix • other managerial policies ... S. Chopra/Operations/Process Analysis & Apps
Product Mix Decisions: Open or Laparoscopic Surgery Revenue per open surgery: $15,000 Variable Cost of Materials: $1,000 Revenue per Laparoscopic surgery:$18,000 Variable Cost of Materials: $2,000 S. Chopra/Operations/Process Analysis & Apps
Product Mix Decisions Open and Laparoscopic have exactly the same process. The only difference is in surgery (laparoscopic takes 30 minutes extra) and in the rooms (laparoscopic uses rooms for 2 days whereas open uses rooms for 4 days. S. Chopra/Operations/Process Analysis & Apps
Product Mix Decisions Margin per Open surgery = $14,000 Margin per Laparoscopic surgery = $16,000 Margin per week from Open surgery = 72.72*(15,000 - 1,000) = $1,018,055 / week Margin per week from Laparoscopic surgery = 63.15*(18,000 - 2,000) = $1,010,400 / week S. Chopra/Operations/Process Analysis & Apps
Learning Objectives: Process Analysis • Manage better with the three key operational measures and an inter-functional macro process view of the organization • Process measures: • Flow time manage critical activities • Capacity manage bottleneck resources • Levers for improving • Flow time manage critical activities • Capacity & Throughput • Many marketing and financial decisions are linked to process • Effect of product mix decisions on process capacity • marginal contribution per unit of bottleneck capacity used • Bottleneck may shift on adding capacity • diminishing returns to capacity investment S. Chopra/Operations/Process Analysis & Apps