Download
1 / 34
340 likes | 365 Views
Explore the evolving landscape of liner shipping, freight growth, and maritime trade. Learn about the impact of increasing vessel sizes, emerging global hubs, trade volumes, and the role of top shipping lines.

E N D
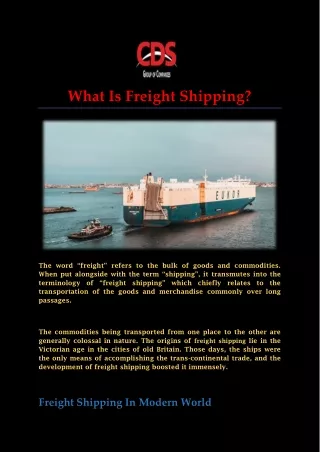
Liner Freight Shipping What is really happening and why? Neil Aplin, Steve Meyrick and Anya Richards Meyrick & Associates
The Situation • Sizeable growth in the demand for shipping capacity into and out of Australia • Resulting in demand for improved • Handling and storage facilities • Land-side access to ports for both modes • Channel deepening at certain ports • Adelaide • Melbourne & Geelong Meyrick & Associates
Evidence …container throughput is expected to increase at Australia’s mainland capital city ports by about 80 per cent by 2010 Meyrick & Associates
Indicative Estimates Meyrick & Associates
Four Questions • What is driving container growth? • Is increasing ship size driving concentration in liner shipping? • Are larger vessels leading to fewer calls and marginalisation of ‘second tier’ ports? • Is growth in transhipment activity leading to the emergence of a small number of global hubs? Meyrick & Associates
The Growth in Freight • What is the experience in the SE Asian Region? Meyrick & Associates
Growth History of Container Trades Compound Average Growth Rate Meyrick & Associates
Container Trade and Maritime Trade Meyrick & Associates
World Economic Growth Meyrick & Associates
Policies and structure to reduce barriers to trade and investment Policies that shift resources to market production Global initiatives Regional initiatives Privatisation Reduction in scale of Government Developments in Public Policy General acceptance of trade as the engine of economic growth Acceleration in Growth in Trade Volumes Change in the composition of Trade Meyrick & Associates
1950-1960 1960-1970 1970-1980 1980-1990 1990-2000 Globalisation in Action Ratio of Growth in Export Volumes to World GDP Growth 5.0 4.5 4.0 3.5 3.0 2.5 2.0 1.5 1.0 0.5 0.0 Source: LINK project background papers Meyrick & Associates
Ratio of Increase in Trade Volume to Sectoral Production 4.00 3.50 3.00 2.50 Ratio 2.00 1.50 1.00 0.50 0.00 Agricultural Mining Manufacturing Increased Role of Manufactures Meyrick & Associates
Medium to Long Term Growth Source: KMI ESCAP Study Meyrick & Associates
4000-4999 TEU 1% 0-999 TEU 3000-3999 TEU 17% 6% 2000 1000-1999 TEU 34% 0-999 TEU 5000-9999 TEU 2000-2999 TEU 10% 17% 42% 1000-1999 TEU 23% 1990 4000-4999 TEU 14% 3000-3999 TEU 2000-2999 TEU 17% 19% Slots Shares 1990 and 2000 Meyrick & Associates
0-999 TEU 3% 1000-1999 TEU 9% 5000-9999 TEU 39% 2000-2999 TEU 16% 3000-3999 TEU 10% 4000-4999 TEU 23% Slots on order Meyrick & Associates
1200 2000 1000 800 1990 600 400 200 0 0-999 1000-1999 2000-2999 3000-3999 4000-4999 5000-9999 The Fully Cellular Fleet Vessel Size (TEU) Meyrick & Associates
The Top 20 Lines… Meyrick & Associates
Top 20 Lines – some statistics • 58% of total container fleet tonnage • 74% of cellular tonnage • 73% of Newbuilding tonnage • 100% of post-Panamax vessels • Capacity of ships on order is (roughly) equal to the total capacity of next 20 lines Meyrick & Associates
Does one lead to another? • Number of strings operating in major East-West routes has risen rapidly: more rapidly than ship size • Market share required to support one string has consequently dropped • Individual lines can and do fund full string fleets • Liner shipping companies have always had ways of securing economies of scale without merger Meyrick & Associates
Trade lane agreements Late 1980s- Early 1990s Global Alliances Mid-1990’s Deeper and Deeper.. Mergers and acquisitions Late 1990s/2000s Meyrick & Associates
Regulation of Liner Shipping • Dominance of economic liberalism • Shipper activism • European Community • Changes in forms of cooperation • Discussion agreements • Alliances Meyrick & Associates
Vessel Size Meyrick & Associates
Shanghai Qingdao Yantian Xingang Ningbo Xiamen Chiwan Shekou Colombo Aden Salalah Khor Fakkan Jebel Ali Bigger Ships, Fewer Ports? • Marsaxlokk • Gioia Tauro • Thamesport • Antwerp • Kwangyang • Laem Chabang • Tanjung Priok • Tanjung Pelepas Meyrick & Associates
Bigger Ships, Fewer Calls? Ports calls per sling Meyrick & Associates
Economies of Scale Cost per TEU per day $45.00 $40.00 $35.00 $30.00 $25.00 $20.00 $15.00 $10.00 $5.00 $- 50 100 200 500 1000 1500 2000 2500 3000 4000 5000 6000 8000 10000 12000 Size (TEU) Meyrick & Associates
100% 90% 80% 40,387,373 117,692,066 70% 60% 50% 40% 23,765,742 51,320,740 30% 20% 56,281,219 20,070,663 10% 0% 1990 2000 Share of World Total Top 5 Next 15 Rest Increasing concentration in ports? Meyrick & Associates
From 1990 to 2000…. • Overall containers handled grew by 267% • Containers handled by the 1990 top 20 increased by 224% • Only three of the 1990 top twenty grew faster than world average (Singapore, Hong Kong, and Long Beach) Meyrick & Associates
Busan Kwangyang Tokyo/Yokohama Shanghai Kobe Taichung Keelung Kaohsiung Port Klang Hong Kong Tanjung Pelepas Singapore Colombo Transhipment - Asia Meyrick & Associates
Transhipment Shares Meyrick & Associates
Future of Transhipment At a global level, transhipment growth as share of total may have peaked • SE Asia/East Asia a relatively mature transhipment market • Mediterranean, Gulf approaching that point • Central America/Caribbean – still scope • India? More distributed transhipment operations Meyrick & Associates
Top 5 port operators Share of global market Meyrick & Associates
Drivers of Concentration NOT Economies of physical scale BUT Customer services requirements Logistical efficiencies Information and skills Government policies Meyrick & Associates
Ships come to the cargo Serves Local Trade Cargo comes to the ships Serves Non-Local Trade Carrier-driven port development Traditional Paradigm Emerging Paradigm Meyrick & Associates
Four (Provisional) Answers • Structural changes in trade driven by economic liberalisation • No: Organisational factors, information and skill needs, customer needs more important • No: More ports than ever are on major East-West itineraries and this will continue • No: Transhipment activity is fragmenting and becoming more mobile, and t/s momentum will probably slow Meyrick & Associates