Download
1 / 38
380 likes | 565 Views
Spatial and temporal patterns in food web accumulation of Hg. San Francisco Mercury Coordination Meeting February 20, 2008. Questions addressed. Spatial patterns: Where is most bioavailable mercury in the Bay? Using small fish as biosentinels Comparing with sediment MeHg data Regions

E N D
Spatial and temporal patterns in food web accumulation of Hg San Francisco Mercury Coordination Meeting February 20, 2008
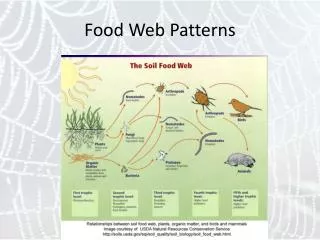
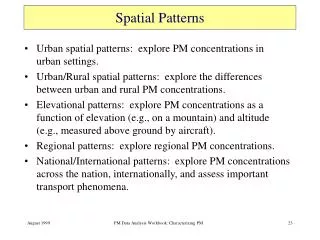
Questions addressed • Spatial patterns: Where is most bioavailable mercury in the Bay? • Using small fish as biosentinels • Comparing with sediment MeHg data • Regions • Habitat types and conditions • Temporal patterns: How does mercury vary in small fish from year to year?
Spatial patterns: Organized by species habits Wetlands/margins Open waters
Spatial patterns: Regional patterns across Bay • 2005 elevated in southern stations (significant) Hg wet weight (g/g) • 2006 elevated in Pt. Isabel (significant)
Spatial patterns including salt pond data Includes data provided by C. Eagles-Smith and J. Ackerman
2005 elevated in southern stations (not significant) • 2006 elevated in southern stations, Pt. Isabel, and Richardson Bay (significant)
Potential explanations for spatial patterns: • High sediment MeHg in southern stations, Richardson Bay • Suggests linkage: fish vs. sediment MeHg • Suggests spatial gradient Source: RMP
Sediment MeHg may be correlated with topsmelt Hg • Topsmelt 2006 data • RMP and Calfed • sediment data within 1.5 km disk of fish • R2 = 0.61
Sediment MeHg higher in shallow/nearshore sites Sediment MeHg: < 1 ng/g 1 – 2 ng/g > 2 ng/g
MeHg Hotspots in Sediment < 2 ng/g Concentrations highest close to shoreline and surrounded by land > 2 ng/g
Hypothesis: Importance of enclosed areas like Pt. Isabel and Richardson Bay
How Hg varies from year to year?Mississippi silverside • Station effect • Year effect • Interaction term not significant • Disconnect from patterns seen in Delta/Suisun Bay (Slotton et al.)
Topsmelt • Station effect • Year effect • Similar to Slotton et al. 2006 higher than 2005!
Summary • Interannual variation differs among species (habitat types) • Elevated in some salt ponds • Apparent association between sediment and biosentinel MeHg New • Hg entering food web at Bay margins, tributaries, wetlands, salt ponds • South Bay and nearshore or enclosed hotspots (Pt. Isabel, Richardson Bay) Q1 Q2 • Sediment net methylation may be locally important process for food web accumulation
Next step: more intensive survey • Spatial survey of about 40 stations/yr (3 years) • Annual monitoring at 8 stations to determine trends • Monthly monitoring at 2 stations to determine seasonal variation • External collaborations • Combining efforts with UC Davis team • Diffusive Gradient in Thinfilm Devices, Bivalves (Hintelmann and Best) • Stable Hg isotopes in fish (Blum)
Collaboration/Data Sharing… Andy Jahn Mark Sandheinrich Kristen Cayce Collin Eagles-Smith Josh Ackerman Wes Heim SF Bay Regional Board Field/Lab Work and Site Access… Katie Harrold Aroon Melwani John Oram Carrie Austin Max Delaney Fred Hetzel Richard Looker April Robinson Meg Sedlak SF Bay National Wildlife Refuge USFWS Stockton USGS BRD California State Parks CA Department Fish & Game Interagency Ecological Program
Spatial survey • Targeting 40 locations • Multiple interrelated factors • Land use, land cover, and Hg sources • Spatial location in Bay • Subtidal hydrology and bathymetry • Sediment physical and chemical parameters
Workplan: Specific questions to address • Where is mercury entering the Bay food web? • What habitats, conditions, or factors help to identify hotspots of food web accumulation in Bay margins? • Are there interannual trends in MeHg bioaccumulation resulting from wetland and margin restoration activities? • What are the best biomonitoring tools for characterizing hotspots of MeHg bioaccumulation?
Spatial survey potential design • Focus on four types of location – test hypothesis of effect • Include spatial gradient from North to South Bay • Also consider subtidal bathymetery/hydrology • Focus on topsmelt and Mississippi silverside
Potential sampling locations – • E.g., POTW outfalls: • Fairfield-Suisun • Palo Alto • Sunnyvale • San Jose
Coordinate with SBMP sites: Improve understanding of wetland – Bay linkages Topsmelt Silversides Marsh fish Brine flies Song sparrows
Trend Sampling Locations Hamilton Benicia Park China Camp Control Point Isabel Impact (Restoration) Oakland Middle Harbor Candlestick Point Eden Landing Bird Island/ Steinberger Slough Newark Slough Alviso Slough
Trend Sampling Locations Hamilton Benicia Park China Camp Control Point Isabel Impact (Restoration) Oakland Middle Harbor Candlestick Point Eden Landing Bird Island/ Steinberger Slough Newark Slough Alviso Slough
Monthly sampling locations Additional North Bay Station Sampled by USFWS Martin Luther King Shoreline
Collection of additional parameters • Aimed at better understanding mechanisms for spatial variation in bioavailable Hg • GIS spatial parameters • Sediment parameters
Sediment parameters Sediment parameters: redox, TON, grain size, total and methyl Hg Duplicate sediment samples at subset of 20 stations
Questions for the Workgroup • Is the general approach appropriate? • Indicators selected • Allocation of effort to spatial vs. interannual vs. monthly vs. tool comparison • Spatial survey design • Hypothesis testing approach • Sampling sites (wetlands, POTWs) • Trend sampling • Annual sampling sites • Monthly sampling sites • Additional parameters • Sediment parameters