Download
1 / 24
250 likes | 349 Views
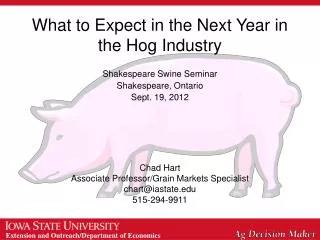
What to Expect in the Next Year in the Hog Industry. Shakespeare Swine Seminar Shakespeare, Ontario Sept. 19, 2012 Chad Hart Associate Professor/Grain Markets Specialist chart@iastate.edu 515-294-9911. Livestock Marketing Information Center Data Source: USDA-AMS & USDA-NASS.

E N D
What to Expect in the Next Year in the Hog Industry Shakespeare Swine Seminar Shakespeare, Ontario Sept. 19, 2012 Chad Hart Associate Professor/Grain Markets Specialist chart@iastate.edu 515-294-9911
Livestock Marketing Information Center Data Source: USDA-AMS & USDA-NASS
Spring 2012 Capacity at 5.4 days/week = 2.38 million head/week Livestock Marketing Information Center Data Source: USDA-AMS & USDA-NASS
Livestock Marketing Information Center Data Source: USDA-AMS & USDA-NASS
Livestock Marketing Information Center Data Source: USDA-AMS & USDA-NASS
Livestock Marketing Information Center Data Source: USDA-AMS, Compiled & Analysis by LMIC
U.S. Meat Production & Prices Source: USDA-WAOB
Hog Crush Margin The Crush Margin is the return after the pig, corn and soybean meal costs. Carcass weight: 200 pounds Pig price: 50% of 5 mth out lean hog futures Corn: 10 bushels per pig Soybean meal: 150 pounds per pig Source: ISU Extension
Potential losses Sept-12 through Jul-13 @ average of $34.64/head Source: Lee Schulz, ISU Extension
Quarterly Forecasts Source: LMIC
U.S. Pork Projections Source: FAPRI-MO
U.S. Corn Supply and Use Source: USDA-WAOB
U.S. DDG Supply and Use My estimates, so take with a grain (or pound) of salt
U.S. Soybean Meal Supply and Use Source: USDA-WAOB
World Corn Production Source: USDA-WAOB
Current Corn Futures 7.18 6.14 5.61 Source: CME Group, 9/12/2012
Total Acreage Shift Source: USDA-NASS
Corn Projections Source: FAPRI-MO
Thoughts for 2013 and Beyond • Breeding herd liquidation in Canada has picked-up • Year-over-year increases in sows sent to the U.S. for slaughter • Farrowing intentions (% year ago): -1.4 in 2012.qt3 and -1.3 in 2012.qtr4 • Domestic demand struggling • Down 6% in 2012.qtr2 compared to 2011.qtr2 • Exports increasing in importance • Export demand up 5% in 2012.qtr2 compared to 2011.qtr2 • First six months of the year exports are 12% above year ago levels Source: Lee Schulz, ISU Extension
Thoughts for 2013 and Beyond • Supply/demand concerns • Soil moisture • South America gets 1st chance to respond to drought pricing • Will supply be able to keep pace with demand? • Drought is pulling supply down • But high prices are diminishing demand • General economic conditions • Continued worldwide economic recovery is a key for crop prices • US job recovery, European financial concerns, China? • 2012/13: USDA: Corn $8.20; Soy $16.00 Futures (as of 9/12/12): Corn $7.18; Soy $16.20 • 2013/14: Futures Corn $6.14; Soy $13.09 • 2014/15: Futures Corn $5.61; Soy $12.46
Thank you for your time!Any questions?My web site:http://www.econ.iastate.edu/~chart/Iowa Farm Outlook:http://www.econ.iastate.edu/ifo/Ag Decision Maker:http://www.extension.iastate.edu/agdm/