Download

1 / 37
370 likes | 391 Views
Learn about the innovative Alternative Quality Contract (AQC) model developed by Blue Cross Blue Shield of Massachusetts to improve quality, slow spending growth, and drive performance incentives in healthcare. Discover the key components, results, incentives, and impacts on population health. Explore the 5-year sustainable partnership and how provider payments are linked to quality outcomes. Dive into the AQC results, formal evaluations, and success factors shaping the future of healthcare delivery.

E N D
The Alternative Quality Contract Lisa Whittemore, MSW, MPH Blue Cross Blue Shield of Massachusetts Presentation to Maine Accountable Care Innovation November 18, 2014
Agenda • Context for AQC Development • Overview of AQC Model • AQC Results: Initial Years • AQC Support and Improvement Analytics • Local and National Policy Context • Summary and Discussion
Economic Imperative in a Global Economy Average spending on healthper capita ($US PPP) Total expenditures on healthas percent of GDP Source: OECD Health Data 2011 (Nov. 2011).
The Massachusetts health reform law (2006) caused a bright light to shine on the issue of unrelenting double-digit increases in health care spending growth (Health Care Reform II). The Alternative Quality Contract: Twin goals of improving quality and slowing spending growth In 2007, leaders at BCBSMA challenged the company to develop a new contract model that would improve quality and outcomes while significantly slowing the rate of growth in health care spending. Sources: BCBSMA, Bureau of Labor Statistics.
The Alternative Quality Contract • Global Budget • Population-based budget covers full care continuum • Health status adjusted • Based on historical claims • Shared risk (2-sided) • Trend targets set at baseline for multi-year • Quality Incentives • Ambulatory and hospital • Significant earning potential • Nationally accepted measures • Continuum of performance targets for each measure (good to great) • Long-Term Contract • 5-year agreement • Sustained partnership • Supports ongoing investment and commitment to improvement
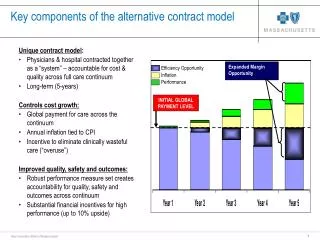
Performance on quality Inflation (cumulative) Identify savings within budget EXPANDED MARGIN OPPORTUNITY INITIAL GLOBAL PAYMENT LEVEL INITIAL GLOBAL PAYMENT LEVEL Year 1 Year 2 Year 3 Year 4 Year 5 Key Components of the AQC Model Unique contract model: • Accountability for quality and resource • use across full care continuum • Long-term (5-years) Controls cost growth: • Global population-based budget • Two-sided risk • Risk adjusted • Incentive to eliminate clinically wasteful care (“overuse”) • Improved quality, safety & outcomes: • Robust performance measure set creates accountability for quality, safety & outcomes across continuum • Substantial financial incentives for high performance
Performance Payment Model: Updated (2011) Quality Performance Incentive Provider Share of Surplus (increases as quality improves) Provider Share of Deficit (decreases as quality improves) As quality improves, provider share of surplus increases/deficit decreases Linking Quality and Efficiency The 2011 AQC ensures that providers have a strong incentive to focus on both objectives. 80% 70% 55% PMPM Quality Dollars The 2011 AQC also allows groups to earn PMPM quality dollars regardless of their budget surplus or deficit. High quality groups earn more PMPM quality dollars. 40% 20% PMPM 1.0 2.0 3.0 4.0 5.0 Performance Score
AQC Physician Participation(Current as of August 2014) 89% 85% *2014 figures as of August.
Results Under The AQC:Improvement of the 2009 Cohort of AQC Groups from 2007-2012 Adult Chronic Care Pediatric Care Adult Health Outcomes 100 Optimal Care 50 = These graphs show that the AQC has accelerated progress toward optimal care since it began in 2009. The first two scores are based on the delivery of evidence-based care to adults with chronic illness and to children, including appropriate tests, services, and preventive care. The third score reflects the extent to which providers helped adults with serious chronic illness achieve optimal clinical outcomes. Linking provider payment to outcome measures has been one of the AQC’s pioneering achievements.
AQC Results: Formal Evaluation Findings Source: Song Z, et al. Changes in Health Care Spending and Quality 4 Years into Global Payment. The New England Journal of Medicine. 2014.
Total Cost Results The Harvard evaluation documented that AQC is reducing medical spending, but accounts also want to see reductions in total spending By Year-3, BCBSMA met its goal of cutting trend in half (2 years ahead of plan) By Year-4, BCBSMA total cost trend was below state general economic growth benchmark (<3.6%) AQC Total Cost Increases (FFS + incentives)
Narrowing Disparities: AQC Performance and Socioeconomic Vulnerability AQC groups with more vulnerable populations were able to equal and even exceed quality scores of those with less vulnerable populations. AQC groups that preformed less well have subsequently improved processes and have demonstrated early indications of improvement. Increasing Vulnerability Notes: (1) Vulnerability Index factors include: race/ethnicity, educational, economic, and social.
Five Keys Ingredients to AQC Success 1 Measures. The measures are nationally accepted as clinically appropriate so there is wide support for improving performance on these indicators. Data , Reports, Advice. Dynamic/actionable data and reports made available daily, monthly and quarterly, helping organizations to identify efficiency opportunities at a patient, practice and organizational level. 4 2 Financial Incentives. Real dollars are at stake for improvement. Leadership. Each group has strong engaged leadership driving to success on integrating care, significantly improving quality and reducing costs. 5 3 Targets. For each measure, there is a range of performance targets representing a continuum from good care to outstanding care, so the model rewards both performance and performance improvement.
Components of the AQC Support Model Our four-pronged support model is designed to help provider groups succeed in the AQC. Data and Actionable Reports Consultative Support Best Practice Sharing and Collaboration Training and Educational Programming
Data and Actionable Reports We distribute reports that can be used to help organizations recognize opportunities, develop goals and measure their success. • Daily • Daily Census, Discharge, PCP Referrals and Inpatient & Outpatient Authorization Reports • Weekly • New Member Report • ED Utilization Report • Monthly • AQC Member Call Tracking Grid • Monthly Ambulatory Quality Report • Monthly AQC Ambulatory Quality Measures Group Comparison Report • Chronic Condition Opportunities Report • Quality Diabetic Composite Score • Bi-Monthly • Case Management Report • Quarterly • Ambulatory Care Sensitive Conditions Report • AQC Financial Dashboard • Non-Emergent ED Report • Top 100 Rx Report • Bi-Annually • Practice Pattern Variation Report—Episode Treatment Groups (ETG) • Practice Pattern Variation Report—Emergency Department Use for Specific Conditions • Annually • Readmission Report • AQC Ambulatory Quality Measures Score/Results • AQC Hospital Quality Measures Score/Results • Recurring • Cost and Use Report • Site of Service Report
New AQC Provider Dashboard The updated dashboard provides actionable data, gives providers tools to more actively manage the growth of medical trend and benchmarks them against other groups.
Practice Pattern Variation Analysis (PPVA) Unpacking differences in the treatment components of specific episodes across clinicians in a single, defined medical specialty. The results are highly actionable because they get to the root of variations in treatment costs for a defined and highly-specific clinical circumstance among physicians of the same specialty Source: Greene RA, et al. Health Affairs 2008; w250-259
Benign Hypertension, With and Without Comorbidity Individual Primary Care Physicians Rate of ARB Use per 100 Episodes with ACE-I and/or ARB 2007 100 Rate = Episodes with ARB / Episodes with ACE-I and/or ARB 90 80 70 • The 12 primary care physicians in this group have rates of ARB use ranging from 13% to 55%. • 9 physicians have rates above the network average. • The 12 primary care physicians in this group have rates of ARB use ranging from 13% to 55%. • 9 physicians have rates above the network average. 60 with ACE-I and/or ARB Rate of ARB Use per 100 Episodes 50 40 30 20 10 0 1 355 709 1063 1417 1771 2125 2479 2833 Individual Primary Care Physicians (N=3178)
Tendency to Use Upper GI Endoscopy: Group Example
Change in Performance Over Time:Rate of Upper GI Endoscopy per 100 Episodes
Change in Performance Over Time:Rate of MRI per 100 Episodes for Low Back Pain
Change in Performance Over Time: Use of PPVA to Reduce Overuse of Visco Therapy Sample Group Data Sharing Intervention with Ortho Sample Group
Delivery System Innovation: Four Themes There are four domains in which we see AQC Groups innovating to improve quality and outcomes while reducing overall spending.
2006 2007 2008 2009 2010 2011 2012 Key Affordability / Cost-Related Developments in Massachusetts
Payment and Delivery System Reform AQC Pioneer ACOs Global budgets Fee-for-Service Medicare Shared Savings Plan Payment Integration Comprehensive Primary Care Initiative Small isolated practices Integrated delivery system Delivery System Integration Adapted from: A. Shih, K. Davis, S. Schoenbaum, A. Gauthier, R. Nuzum, and D. McCarthy, Organizing the U.S. Health Care Delivery System for High Performance (The Commonwealth Fund, Aug. 2008).
Summary and Priority Issues Ahead Summary Priority Issues Ahead • Payment reform gives rise to significant delivery system reform • Rapid and substantial performance improvements are possible in the context of: • Meaningful financial incentives • Rigorously validated measures & methods • Ongoing and timely data sharing and engagement • Committed leadership • For payment reform, deep provider relationships and significant market share are advantageous • For national payers, remote provider relationships pose engagement challenges; member-facing incentives (benefit design) an attractive lever • Expanding payment reform to include PPO • Requires attribution model • Requires national data exchange (multi-state accounts) • Payment incentives to front line clinicians need continued attention • Continued evolution of performance measures • Focus on outcomes, including patient reported outcomes (functional status, well being) • Continued delivery system reform, including: • Advancing innovations in virtual care • Evolving the role of hospitals and hospital care • Deeper engagement of specialists • Managing consolidation