Download

1 / 59
590 likes | 759 Views
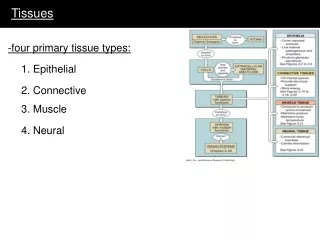
TISSUES. Brain: Fuel reserve: essentially none (small glycogen store in some non-neuronal cells) Metabolism: strictly aerobic Preferred fuel: glucose (obligatory), uses ketone bodies during prolonged fast, can use lactic acid Fuel exported: none.

E N D
Brain: Fuel reserve: essentially none (small glycogen store in some non-neuronal cells) Metabolism: strictly aerobic Preferred fuel: glucose (obligatory), uses ketone bodies during prolonged fast, can use lactic acid Fuel exported: none
· High respiratory rate. Accounts for ~ 20% of bodies oxygen consumption in adult. · Glucose is an obligate metabolic fuel. Brain utilizes about 120g glucose a day. · Because brain does not synthesis or store glycogen it is dependent on a continuous supply of glucose from circulation. · Under normal of elevated blood [glucose] rate of blood-to-brain transfer exceeds rate of brain glucose metabolism. At low blood [glucose], blood-to-brain transfer becomes limiting. · Can adapt to use of ketone bodies during fast (note: long chain FA cannot cross blood brain barrier and cannot be used as fuel by brain) but still require carbohydrates. KB may account for as much as 60% of fuel after prolonged fast.
Skeletal muscle: Fuel reserve: glycogen (P-creatine) Metabolism: at rest or during prolonged activity - aerobic short, vigorous activity – glycolytic (anaerobic) Preferred fuel: fatty acids, glucose during vigorous activity Fuel exported: lactate, alanine Hormones: insulin, adrenalin ·accounts for ~ 30% of O2 consumption at rest. This may increase to as much as 90% during vigorous exercise.
· effects of exercise ·short, vigorous (eg 100 M sprint) ·fueled by P-creatine and glycolytic ATP ·in 10 sec. sprint muscle P-creatine decreases from 9.1 to 2.6 mM ATP from 5.2 to 3.7 mM (what is the effect of this on glycolytic rate?). blood lactate increases from 1.6 to 8.3 mM and blood pH decreases from 7.42 to 7.24. Acidosis causes fatigue. ·longer (eg, 1000 M run) ·aerobic energy, oxidation of muscle glycogen - energy produced at a slower rate so pace is slower.
·very long periods of exercise (eg marathon) ·uses liver as well as muscle glycogen supply - even slower rate of energy production. Muscle and liver glycogen combined are insufficient to provide fuel required for marathon (require about 150 mols ATP, muscle and liver glycogen provide at most about 105 mols). Difference made up from fat reserves - but this is even slower rate of energy production so pace slow further. Elite runners stretch out glycogen supply and can maintain faster pace longer. )
21 year old Kenyan wins New York marathon 1994 How much glycogen is this person using?
Heart muscle: Fuel reserves: glycogen (P-creatine) Metabolism: strictly aerobic Preferred fuel: fatty acids, also uses ketone bodies and glucose Fuel exported: none Hormones: insulin, adrenalin
Adipose tissue: Fuel reserve: TAGs, some glycogen Metabolism: aerobic Preferred fuel: fatty acids, also uses glucose Fuel exported: fatty acids, glycerol Hormones: insulin, adrenalin
Adipocytes con’t ·TAGs may account for as much as 65% of weight of fat cell. ·FFAs bind to serum albumin for transport in serum. ·receives exogenous TAGs in chylomicron from intestinal system (note: these travel to circulation via lymphatic system and largely bypass liver) ·high bld glucose - glucose used for FA and TAG synthesis ·requires source of glucose to make TAGS (lacks glycerol kinase)
Liver: Fuel reserve: glycogen Fuel exported: glucose, fatty acids (VLDLs) Metabolism: aerobic Preferred fuel: fatty acids, also uses glucose Hormones: insulin, adrenalin, glucagon Other roles: N detoxification and export of urea, synthesis of serum proteins, synthesis of bile acids, cholesterol (incorporated into VLDLs)
Liver con’t ·critical in maintenance of glucose homeostasis ·most incoming nutrients are delivered to liver via the portal vein (chylomicron are the exception) where they are processed to fuels and precursors for other tissues. ·glucose sensors: high Km GluT2, high Km glucokinase, phosphorylase ·fasting state: glycogenolytic/gluconeogenic/lipolytic ·fed state: glycogenesis/glycolytic/lipogenic
Liver con’t · Metabolism of fats · FA used for local P-lipids · FFA are major oxidative fuel for liver · synthesis of ketone bodies when CHO are limiting and there is large mobilization of TAGs from adipose tissue. · AcCoA used for synthesis of FA, cholesterol, ketone bodies synthesizes lipoproteins and forms VLDL for delivery of fats to other tissues.
Liver con’t ·amino acids ·high protein diet - amino acids are used for the synthesis of liver proteins and the majority of serum proteins, including albumin. (Low serum albumin levels is diagnostic of liver pathology.) Amino acids also catabolized to provide precursors for gluconeogenesis and for energy production via the TCA cycle. ·detoxifies N through formation of urea. (ala/glucose cycle) ·high CHO/low protein - most amino acids pass through because of high Km of catabolic enzymes for amino acids. Note: all except elite endurance athletes obtain adequate protein in diet and protein supplements not required!
Liver con’t ·carbohydrate ·stores CHO as glycogen and exports glucose derived from glycogen gluconeogenesis: synthesis glucose from low Mr precursors - lactate., alanine TCA cycle intermedicates Cori cycle Alanine/glucose cycle
Red blood cell Fuel reserve: none Metabolism: anerobic Preferred fuel: glucose (obligatory) Fuel exported: lactic acid ·formation of 2, 3 bis-phosphoglycerate for maintenance of low affinity form of haemoglobin ·role of HMPS in maintaining NADPH and reduced glutathione
Kidney ·role in N metabolism: secretion of NH4+, urea · during kidney disease N end products (urea, creatinine, uric acid) accumulate. high CHO diet with amino acids limited to essential amino acids may help regulate this – liver can synthesize non-essential amino acids. ·secretion of excess ketone bodies ·some gluconeogenic activity - eg from glutamine via a-ketoglutarate ·acid-base regulation: excess H+ secreted as NH4+, during acidosis renal activity for the production of NH4+ increases ( NH4+ , gluconeogenesis) and urea production by liver decreases. During alkalosis liver urea production increases and renal NH4+ secretion and gluconeogenesis decreases. ·
Intestine ·small intestine: preferred fuel - glutamine ·colon: preferred fuel : short chain fatty acids produced by bacteria from unabsorbed foods. Excess short chain FA not used by colonocytes pass to portal vein for use by liver. ·colonocytes also produce ketone bodies that are released into portal vein for use by extrahepatic tissues
Tissue fuel reserve preferred fuel fuel exported hormone recep Brain none glucose (ketone bodies) strictly aerobic none Skeletal muscle glycogen (P-creatine) FA : aerobic glucose vigorous activity-anaerobic lactate alanine (fasting, excessive activity) adrenalin, insulin heartmuscle glycogen (P-creatine) fatty acids (glucose, ketone bodies) strictly aerobic none adrenalin insulin fatcells TAGs fatty acids: aerobic fatty acids glycerol adrenalin insulin liver glycogen fatty acids glucose fatty acids adrenalin glucagon insulin
Epinephrin/Adrenalin target tissue: liver, muscle, fat cells receptors: a and b (g protein linked) source: adrenal medula when: stress; release controlled by the nervous system Physiological effects: ·increased heart rate ·blood pressure ·dilation of respiratory passages ·net effect: increased oxygen delivery
Metabolic effects: ·increase muscle and hepatic glycogenolysis ·increase hepatic gluconeogensis ·increase lipolysis ·glycogen breakdown(L,M) phosphorylase ·gluconeogenesis (L) F1,6 bis Pase, pyruvate kinase ·glycogen synthesis (L,M) glycogen synthase ·glycolysis (hM) PFK1 (indirectly by effect on F2,6 bis P levels) ·FA mobilization (A) TAG lipase note: also results in increased glucagon secretion and decreased insulin secretion, thereby reinforcing effects.
Glucagon ·Source: a-cells of pancrease ·when: low blood glucose, release stimulated by adrenalin (release inhibited by insulin) ·target tissues: liver, fat cells, heart muscle
Metabolic effects of glucagon con’t: ·increase glycogenolysis and gluconeogenesis ·increase lipolysis and oxidation of FA ·increase uptake of amino acids · · · glycogen breakdown(L,hM) phosphorylase Gluconeogenesis(L) F1,6 bis Pase (indirectly by effect on F2,6 bis P levels) pyruvate kinase glycogen synthesis (L,hM) glycogen synthase
Metabolic effects of glucagon con’t: glycolysis (L) PFK1 levels (indirectly by effect on F2,6 bis P levels) FA mobilization (A) TAG lipase fatty acid synthesis (L) ACC fatty acid oxidation (L, A) ACC (results in lower amounts of the inhibitor of ACT, malonylCoA) insulin release from pancreas
Insulin Source: b-cells of pancreas target tissues: liver, muscle, fat when: high blood glucose, amino acids (Arginine), glucagon, gastrointestinal hormones (oral glucose is more potent than intravenous glucose in stimulating insulin release). decreased by: fasting, exercise, a-adrenergic activity
Insulin secretion decreased by increased by D-Glucose Galactose Mannose Glyceraldehyde Glucagon Gastric inhibitory peptide Secretin Cholecystokinin Vagal activity Fasting Exercise Endurance training Somatostatin Galanin Pancreastatin Leptin Interleukin 1 a-adrenageric activity Prostaglandin E2 Protein Arg Lys Leu Ala b-adrenageric activity Sulfonylures drugs Ketoacids FFA K+ Ca2+
Metabolic effects of insulin: ·increase glycogen synthesis (L, M) ·decrease gluconeogensis (L) ·increase glucose uptake (M, A) ·decrease lipolysis (A) · increase amino acid uptake and protein synthesis in most tissue glucose uptakeGlut4 (M,A) glycogen synthesis (L,M) glycogen synthase glycolysis (L) PFK1 (indirectly by effect on F2,6 bis P levels) PDH (yields AcCoA for FA biosyn) glycogen breakdown(L,M) phosphorylase
Metabolic effects of insulin con’t: FA synthesis(L,A) ACC TAG synthesis ( A) lipoprotein lipase glucagon release · · ·
Maintenance of normal blood glucose Normal blood glucose: 70-100 mg/100ml; 4.5 -5,5 mM euglycemia: 90 mg/100mL, -5 mm Blood glucose maintained by regulating balance between insulin and glucagon Hypoglycemia: less than euglycmic concentration; results in neurological impairment even in acute situation Hyperglycemia: greater than euglycmic concentration; damage occurs after more long term hyperglycemia. under euglycemic conditions both insulin and glucagon · are low · when [glucose] > ~4.5 mm insulin secretion is stimulated when [glucose] < ~ 4 mM glucogon secretion is promoted. · Insulin secretion very low when [glucose] is less than 3 mM. · After a meal insulin/glucagon is about 10:1 · between meals insulin/glucagon may be as low as 1:2 Liver normally produces about 10g/hr of glucose, during exercise or fasting this may increase to as much as 40g/hr Glucose consumption by skeletal muscle may increase from about 4g/hr to as much as 40g/hr during exercise.
Relationship between plasma glucose, insulin and glucagon levels Insulin secretion (times normal) euglycemic euglycemic X
Glucose tolerance curves in a control subject and in a subject with diabetes Blood glucose level (9mg/100ml) Fasting subject ingests 1 gm of glucose/kg body weight
Brain Brain Brain Between meals Between meals Insulin Glucagon Glucagon Glucose 10g/h Liver Fat Muscle 4g/h Blood Glucose 4.5 mM Blood Glucose 4.5 mM Liver (glycogenolysis gluconeogenesis) 6g/h 6g/h After a meal Insulin Glucagon Liver Fat Muscle Glucose 0g/h 44g/h Blood Glucose 4.5 mM Liver (glycogenolysis Glycolysis FA synthesis) 6g/h 50g/h CHO from food
Brain Physical work Insulin Glucagon/adrenalin Liver Fat Muscle Glucose 46g/h 40g/h Blood Glucose 4.5 mM Liver (glycogenolysis gluconeogenesis) 6g/h
Distribution of glucose after a meal BRAIN Liver glycogen 17 g 15 g Fat 2 g Glucose in Meal 90 g kidneys Fat TAG 8 g (as lactate) 23 g 25 g Muscle glycogen Muscle immed use
Effect of exercise on blood glucose 120 100 80 glucose (mg/100ml) glucose 60 placebo 40 20 0 0 30 60 90 120 150 180 210 240 time of exercise (min)
III IV V I II 45 exogenous 40 35 30 25 Glucose used (g/h) 20 15 gluconeogenesis glycogen 10 5 0 0h 4h 8h 12h 16h 20h 24h 28h 32h 2d 8d 16d 24d 32d 40d hours days
Well fed state ·energy requirements supplied by diet ·high insulin/low glucagon MOST ENZYMES SUBJECT TO PHOSPHORYLATION BY PKA IN DEPHOSPHORYLATED STATE (What are these enzymes? Which are active and which inactive?) Glycogenolysis, glycolysis and lipogenesis favored. ·most nutrients flow to liver via portal vein, lipids incorporated into chylomicra and go via lymphatic ducts to circulatory system bypassing the liver. ·high insulin promotes glucose uptake by muscle and fat cells because of increased GluT4 glucose transporters in cell surface membranes ·glucose in liver is used for glycogen deposition, hexose monophosphate shunt (NADPH for biosynthesis) and glycolysis. Pyruvate is used to synthesize fatty acids
Well fed state con’t ·much of glucose passes through liver for delivery to other organs: brain and other tissues for oxidation to CO2; red blood cell to lactate and pyruvate (why not to CO2?); adipose tissue to fat; muscle to glycogen as well as glycolysis and TCA cycle. ·note: lactate and or pyruvate produced in tissues other than liver is not converted to glucose by liver (ie. no Cori cycle under these conditions, gluconeogensis not active in absence of glucagon) ·glucose, lactate, pyruvate and amino acids support fatty acid synthesis by liver under well fed conditions. These fatty acids are largely exported in the form of VLDL.
Well fed state con’t ·Protein: hydrolysed to amino acids in intestine. ·most amino acids pass through liver and are not catabolized in liver except when concentration is very high (ie in well fed state) due to high Km of catabolic enzymes. ·amino acids used by liver and other organs for protein synthesis. ·Excess amino acids catabolized by liver to yield urea. Carbons used mainly for fatty acid synthesis ·Dietary fatty acids delivered to adipose tissue in chylomicra, lipases release FA that are taken up by fat cells and stored as TAGs. ·high insulin promotes synthesis of TAGs ·availability of glucose promotes TAG synthesis by supplying glycerol phosphate (ie. DHAP converted to glycerol phosphate)
Early fasting (stage ii) CONSERVATION OF GLUCOSE, LACTATE. ALANINE, PYRUVATE ·glucagon increases/insulin decreases, adrenalin levels increase Activation of PKA and inhibition of PP. Greater phosphorylation of regulatory enzymes (Which are activated? Which inhibited?) ·lipogenesis reduced ( increased phosphorylation of acetylCoA carboxylase), lipid mobilization in fat cells increased via PKA activation of TAG lipase. FA oxidation increased (reduced malonly CoA) ·increase in glucagon favors gluconeogenesis and glycogenolysis in liver ·hepatic gluconeogensis increases and lactate, pyruvate and amino acids otherwise used for fatty acid synthesis are diverted into gluconeogenesis. ·Cori cycle operative ·
Early fasting con’t (stage ii) • · • less amino acid catabolism because dietary source of amino acids no • longer available • ·drop in insulin results in decrease in glucose transporters from muscle • and fat cell surfaces resulting in decreased glucose uptake and • utilization by these tissues. Glucose sparing • Muscle obtains more energy from fatty acid oxidation. Results in • glucose sparing. • Inactivation of PDH in skeletal muscle by increased activity of • PDH kinase – activated by NADH and AcCoA from increase FA • oxidation. • ·3 major factors contribute to glucose sparing at this stage: • ·mobilization of liver glycogen • ·mobilization of fat from adipose cells • ·shift of muscle cells to increased reliance on fatty acids for • energy production
3. Fasting (stage iii) ·glucagon increases/insulin decreases ·no fuel entering gut and liver glycogen largely depleted ·tissues requiring glucose are dependent on hepatic gluconeogenesis, primarily from pyruvate, lactate and alanine coming from other tissues ·glycerol from lipid mobilization in fat cells continues to be an important source of carbon for gluconeogenesis in liver. ·amino acids from protein breakdown in muscle cells provide majority of carbon for glucose synthesis and some ketone body synthesis by liver Increased N metabolism and urea synthesis by liver. ·liver obtains energy from fatty acids ·
Fasting (stage iii) ·OAA is diverted for gluconeogenesis and TCA cycle intermediatesfall. Decrease in citrate further reduces FA synthesis (loss of activation of phosphorylated AcCoA carboxylase by citrate) and enhanced FA oxidation (less inhibition of acylcarnitine transferase I because of further decrease in malonylCoA) ·increased FA oxidation and amino acid catabolism leads to increase in ketone body formation by liver. ·N secretion in the urine shows transient increase during early stages (up to day 3), as a result of increase in urea production and shunting of glutamine to kidney, but then declines. Decline related to glucose sparing effect as ketone body formation kicks in.