Download
1 / 71
720 likes | 988 Views
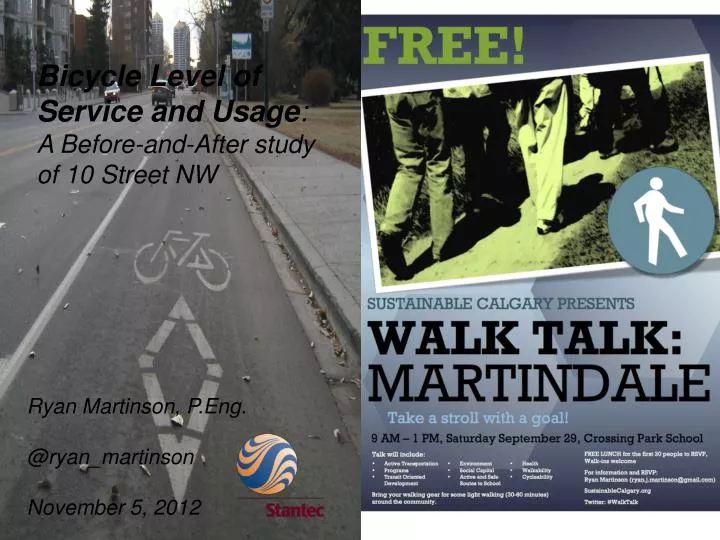
Bicycle Level of Service and Usage : A Before-and-After study of 10 Street NW. Ryan Martinson, P.Eng. @ryan_martinson November 5, 2012. Bicycle Level of Service and Usage: A Before-and-After study of 10 Street NW. Some history.

E N D
Bicycle Level of Service and Usage:A Before-and-After study of 10 Street NW Ryan Martinson, P.Eng. @ryan_martinson November 5, 2012
Bicycle Level of Service and Usage:A Before-and-After study of 10 Street NW
Some history • Major connection into the Downtown from the north across the Bow River • Southern Alberta Institute of Technology and Alberta College of Art and Design located on the street • Was identified to have a bike lane in 2001 with implementation plan • Implementation of 10 Street bike lane followed repaving in 2011 • First bike box in Calgary • Public and Politicians were surprised • City of Calgary did have intersection turning movement counts for intersections located along the route from before and after the bike lanes were implemented • Enter: My study…
Study Objective The design of a facility has been shown to be an influence on whether people will walk or cycle. My study wanted to look at the following: • Is it true: If you build it, they will come. • Use the Multi-Modal Level of Service from HCM 2010 to see what affect the bike lanes had on bike Level of Service. • Using the MMLOS score in conjunction with usage data, a relationship between facility LOS and usage will be sought.
Objective 1 If you build it, will they come?
Count and Segment Locations 2 1 3 4 5 4
Usage Information • 6 hour counts were provided by City of Calgary’s Transportation Data Group • Before bike lanes were implemented • 10 St NW & 20 Ave NW - Thursday, August 26 2010 • 16 Ave NW & 10 St NW - Friday, May 22, 2009 • 10 St NW & 5 Ave NW - Friday, September 3, 2010 • After bike lanes were implemented • 10 St NW & 20 Ave NW - Tuesday, October 18, 2011 • 10 St NW & 13 Ave NW - Tuesday, October 18, 2011 • 10 St NW & 5 Ave NW - Tuesday, October 18, 2011 • Adjustments made to account for: • Day-of-the-Week • Month-of-the-Year • Yearly
Objective 2 Use the Multi-Modal Level of Service from HCM 2010 to see what Effect adding bike lanes on 10 Street has on bike Level of Service.
Multi-Modal Level of Service • Methodology includes an array of performance measures that more fully describes segment operation for multiple travel modes • Measures serve as clues in identifying the source of problems and provide insight into the development of effective improvement strategies
Link, Intersection Segment Facility General Terminology • A link and its boundary intersections are referred to as a segment. An urban street facility is a length of roadway that is composed of contiguous urban street segments and is typically functionally classified as an urban arterial or collector street. • Aggregation of segment performance measures to obtain an estimate of facility performance
Bicycle LOS Methodology • 8-step process • Step 1: Bicycle Running Speed • Step 2: Bicycle Delay at Intersection • Step 3: Bicycle Delay at Intersection • Step 4: Bicycle LOS Score for Intersection • Step 5: Bicycle LOS Score for Link • Step 6: Link LOS • Step 7: Bicycle LOS Score for Segment • Step 8: Segment LOS • No LOS A or B in formula provided in HCM2010 • Data intensive • Time consuming analysis
Count and Segment Locations 1 2 3 4 5
Count and Segment Locations 2 2 1 3 4 5
Count and Segment Locations 2 1 3 3 4 5
Count and Segment Locations 2 1 3 4 4 5
Count and Segment Locations 2 1 3 4 5 5
Objective 3 Using the MMLOS score in conjunction with usage data, a relationship between facility LOS and usage will be sought.
LOS A LOS B LOS C LOS D LOS E Observed Usage and Segment Bicycle LOS
Conclusions • After bike lane implementation, bike usage increased by 39%, on average. • But, are they new users? • Bicycle MMLOS before and after bike lane • Bicycle MMLOS score has some explaining power with respect to increase in usage
Limitations to Methodology • Count data available at different locations, resulting in assumptions being made in volumes and not as robust model • Volume adjustments based on automobile volumes applied to all modes
Future Research • Analysis completed using counts completed at same intersections year-to-year • Adjustments to pedestrian and cycling usage needs to be further explored • Consider Auto, Transit, and Pedestrian LOS along the corridor • Cost-Benefit analysis of bike lane(include health benefits) • Future data collection include various users (gender, age, ability, etc.) • Extend evaluation to different bicycle facilities
Ryan Martinson, P.Eng. November 5, 2012
Take a stroll with a goal WalkTalk:Martindale
Community Attachment • The top three drivers of community attachment, which have been shown to be consistent place to place, are: • Social Offerings - Places for people to meet each other and the feeling that people in the community care about each other • Openness - How welcoming the community is to different types of people, including families with young children, minorities, and talented college graduates • Aesthetics - The physical beauty of he community including the availability of parks and green spaces
Objectives of the WalkTalk • Determine what influences an individual’s behaviour with respect to walking and active transportation; • Provide feedback to the researchers and, possibly, the municipality on how walkability can be improved in an area; • Engage and educate local residents in civic affairs, including walkability and transportation; and • Increase the number of connections people have within their community, ultimately affecting the social capital of the area.
Methodology • What is Martindale? << SETS THE IDENTITY OF THE COMMUNITY, WHO ARE WE? • What is unique about your community? History? Geography? Industry? Institutions? Landmarks? Culture? • What is a walkable community? << SETS THE GOAL • Think of a walkable place that you enjoy, what does it have? What are all the elements? • What walking trips do you do? << SETS THE REALITY • How often? Where to? With who? What time? What is the purpose? • What is stopping you from going more? << SETS THE BARRIERS • What is good about your current walking trips? << BUILDS ON THE POSITIVES • What can we do to break down the barriers? << SETS THE SOLUTIONS • Place, Design, and Program based [Social Offerings (Infrastructure & Civility), Aesthetics, Openness]