LESSON 9: Analyzing DNA Sequences and DNA Barcoding
170 likes | 326 Views
LESSON 9: Analyzing DNA Sequences and DNA Barcoding. PowerPoint slides to accompany Using Bioinformatics : Genetic Research.

LESSON 9: Analyzing DNA Sequences and DNA Barcoding
E N D
Presentation Transcript
LESSON 9: Analyzing DNA Sequences and DNA Barcoding PowerPoint slides to accompany Using Bioinformatics: Genetic Research Chowning, J., Kovarik, D., Porter, S., Grisworld, J., Spitze, J., Farris, C., K. Petersen, and T. Caraballo. Using Bioinformatics: Genetic Research. Published Online October 2012. figshare. http://dx.doi.org/10.6084/m9.figshare.936568
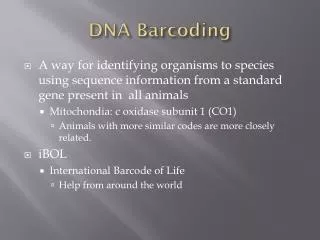
How DNA Sequence Data is Obtained for Genetic Research Obtain Samples: Blood , Saliva, Hair Follicles, Feathers, Scales Genetic Data Compare DNA Sequences to One Another Extract DNA from Cells …TTCACCAACAGGCCCACA… Sequence DNA TTCAACAACAGGCCCAC TTCACCAACAGGCCCAC TTCATCAACAGGCCCAC • GOALS: • Identify the organism from which the DNA was obtained. • Compare DNA sequences to each other. Image Source: Wikimedia Commons
Overview of DNA Sequencing Mix with primers Perform sequencing reaction DNA Sample …T T C A C C A A C T G G C C C A C A… DNA Sequence Chromatogram
Sequence Both Strands of DNA Sequence #1: Top Strand AT G AC G GATCA G C Sequence #2: Bottom Strand Sequence #1: Top Strand T A CTGC CT A GTCG Sequence #2: Bottom Strand Image Source: Wikimedia Commons
Compare the Two Sequences Sequence #1: Top Strand Sequence #1: Top (“F”) Sequence #2: Bottom Strand 5’- AT G AC G G ATCA G C – 3’ Sequence #2: Bottom (“R”) 3’- T A CTGC C T A GTCG – 5’ Bioinformatics tools like BLAST can be used to compare the sequences from the two strands. Image Source: Wikimedia Commons
Analyzing DNA Sequences Day One: 1. Obtain two chromatograms for each sample. Sequence #1: Top Strand 2. Align the sequences with BLAST. Sequence #2: Bottom Strand Day Two: 3. Visualize the chromatograms using FinchTV. Compare BLAST alignments against base calls in chromatogram. 4. Review any differences and determine which base is most likely correct. Sequence #1 Sequence #2 5. Edit and trim the DNA sequence using quality data. AT G AC G G ATCA G C Day Three: 6. Translate the sequence to check for stop codons. T A CTGC C T A GTCG ATGCCGTAA M P STOP 7. Use BLAST to identify origin of sequence. 8. Use BOLD to confirm identity and make phylogenetic tree. Image Source: NCBI, FinchTV, BOLD.
Viewing DNA Sequences with FinchTV Image Source: FinchTV
DNA Peaks Can Vary in Height and Width Image Source: FinchTV
Quality Values Represent the Accuracy of Each Base Call Quality values represent the ability of the DNA sequencing software to identify the base at a given position. Quality Value (Q) = log10 of the error probability * -10. Q10 means the base has a one in ten chance (probability) of being misidentified. Q20 = probability of 1 in 100 of being misidentified. Q30 = probability of 1 in 1,000 of being misidentified. Q40 = probability of 1 in 10,000 of being misidentified.
Quality Values Are Used When Comparing Sequences Quality values represent the ability of the DNA sequencing software to identify the base at a given position. Image Source: FinchTV
Background “Noise” May Be Present Image Source: FinchTV
The Beginning and Ends of Sequences Are Likely To Be Poor Quality Image Source: FinchTV
Examples of Chromatogram Data #1 #2 #3 Circle #1:Example of a series of the same nucleotide (many T’s in a row). Notice the highest peaks are visible at each position. Circle #2: Example of an ambiguous base call. Notice the T (Red)at position 57 (highlighted in blue) is just below a green peak (A) at the same position. Look at the poor quality score on bottom left of screen (Q12). AnAmay be the actual nucleotide at this position. Circle #3: Example of two A’s together. The peaks look different, but are the highest peaks at these positions. Image Source: FinchTV
Analyzing DNA Sequences Day One: 1. Obtain two chromatograms for each sample. Sequence #1: Top Strand 2. Align the sequences with BLAST. Sequence #2: Bottom Strand Day Two: 3. Visualize the chromatograms using FinchTV. Compare BLAST alignments against base calls in chromatogram. 4. Review any differences and determine which base is most likely correct. Sequence #1 Sequence #2 5. Edit and trim the DNA sequence using quality data. AT G AC G G ATCA G C Day Three: 6. Translate the sequence to check for stop codons. T A CTGC C T A GTCG ATGCCGTAA M P STOP 7. Use BLAST to identify origin of sequence. 8. Use BOLD to confirm identity and make phylogenetic tree. Image Source: NCBI, FinchTV, BOLD.
Transcription and Translation Begin at the Start Codon Reading Frame +1 M T D Q 5’- AT G AC G G ATGA G C – 3’ Sequence #1: 3’- T A CTGC CT A CTCG – 5’ Sequence #2:
There Are Six Potential Reading Frames in DNA Reading Frame +3 Reading Frame +2 Reading Frame +1 M T D Q 5’- AT G AC G G ATGA G C – 3’ Sequence #1: 3’- T A CTGC CT A CTCG – 5’ Sequence #2: Reading Frame -1 Reading Frame -2 Reading Frame -3
Frame-Shifts, Amino Acid Changes, and Stop Codons M D G STOP Reading Frame +2 5’- AT G G AC G G ATGA G– 3’ Accidental insertion of an extra “G” when editing Reading Frame +1 M T G E 5’- AT G AC G G ATGA G C – 3’ Sequence #1: 3’- T A CTGC CT A CTCG – 5’ Sequence #2: