Download
1 / 23
230 likes | 326 Views
Explore the relationship between Atlantic SSTs, hurricanes, and the Atlantic Multi-decadal Oscillation, and their impact on the Meridional Overturning Circulation (MOC). Discover how hurricanes affect the global coupled climate system and the MOC's role in North Atlantic SST variability. Investigate potential predictions of the MOC for future climate modeling enhancements.

E N D
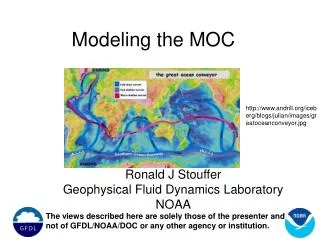
MOC, Hurricanes and the IPCC AR5 Gerald A. Meehl NCAR
Is there a link between Atlantic SSTs, hurricanes, and MOC? Atlantic SSTs north of the equator vary on multi-decadal timescales, often referred to as the Atlantic Multi-decadal Oscillation (AMO) (Knight et al., 2005)
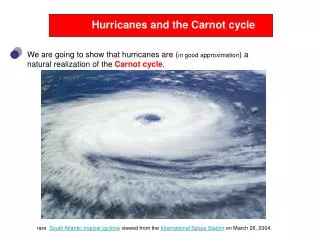
Atlantic hurricane power is associated with Atlantic SSTs So what is the connection between MOC and hurricanes? (Emanuel, 2007)
Long global coupled climate model simulations show that warmer North Atlantic SSTs are associated with a stronger MOC (top), and colder North Atlantic SSTs with a weaker MOC (bottom) Stronger MOC = warmer North Atlantic SSTs = more hurricane power MOC mechanism? It’s complicated—see talks by Carl Wunsch, Ron Stouffer, and Gokhan Danabasoglu in this meeting (Knight et al., 2005)
What is the role of hurricanes in the global coupled climate system? Climatological hurricanes specified in the coupled model first as wind vortices and then as combined wind and precipitation events (one hurricane in June, one in July, three in August, three in September, two in October) Model is run for 100 years with these hurricanes repeating every year, and compared to a model run without hurricanes (from Hu and Meehl, 2008)
Details Hurricane size varies from a radius of 200 km at the time of formation to a radius of 500 km at the end of the track There is initial maximum wind speed of 18 m/s and as the hurricanes move along the prescribed tracks; the winds strengthen to about 53 m/s, equivalent to a category 3 hurricane. In June, July and October, the maximum strength of the hurricanes is category 2 with a maximum wind speed of 43 m/s. The lifetime of the hurricanes varies from 7 to 8 days in June, July, and October to a maximum of 11 days in August and September. Prescribed hurricane precipitation (TRMM data) changes from 0 mm/day at the edge of the hurricane to 60 mm/day at the center of the hurricane initially, then to a maximum of 80 mm/day for a category 2 hurricane and up to 130 mm/day for a category 3 hurricane. The additional freshwater flux is 0.31 Sv into the subtropical Atlantic averaged over the hurricane season, and is balanced by an equivalent amount of evaporation from the ocean surface (to avoid a spurious fresh water source) in the domain of the trade winds in the Atlantic between 20oS and 35oN. The trade winds pick up moisture evaporated from the warm ocean surface and carry that moisture into the Atlantic intertropical convergence zone where hurricanes tend to form and tap that moisture
The combined effect of hurricane winds and rainfall on the model climate is to reduce SSTs and move fresh water west in the tropical Atlantic where it is transported to the North Atlantic (right column)
We have no observations of the climate system “with and without” hurricanes, but we can compare a year with a lot of hurricanes (2005) to a year with not many hurricanes (2006) and look at the differences (both these years have the improved ARGO observed ocean data from the upper 2000 meters) Hurricanes mix heat down into the thermocline in the tropical Atlantic, and the combined effects of hurricane winds and precipitation has the end result of reducing the upper ocean salinity and density of the North Atlantic
The effect of hurricane winds is to mix heat downward, and the increased heat and salty water are transported northward where increased density strengthens the MOC and ultimately contributes to increasing heat transport The combined effects of hurricane winds and precipitation is to mix heat downward, and the increased heat and fresh water are transported northward where the decreased density weakens the MOC and ultimately contributes to reducing heat transport % changes Maybe hurricanes play an active role in multi-decadal MOC and North Atlantic SST variability, and thus feed back on themselves More hurricanes = weaker MOC = cooler North Atlantic SSTs = less hurricanes = stronger MOC = warmer North Atlantic SSTs = more hurricanes
Though the changes in MOC from hurricanes are small, indicating existing models are not missing huge climate effects from hurricanes, some regional systematic errors in could be corrected by resolving hurricanes…for salinity:
Maybe if we could predict the MOC ten or twenty years in advance, that would give us some skill in North Atlantic SST and hurricane predictions Can we predict the MOC? Maybe…
Improved skill is found in initialized hindcasts of global mean surface temperature, explained mainly by ENSO in first year, and by better predictions of upper ocean heat content at longer lead times Global annual mean surface temperature (TS) Global annual mean ocean heat content in upper 113m (H) (Smith et al., 2007)
This leads us into the new research area of “decadal prediction” But as we embark on this new activity, we need an experimental framework One is being proposed by the climate research community to be assessed as part of the upcoming IPCC Fifth Assessment Report (AR5)
Coordinated climate change experiments (formulated by WGCM and AIMES) to be run for assessment in IPCC AR5 • Two classes of models to address two time frames and two sets of science questions: • Decadal prediction (2005-2030) • higher resolution (~50 km), no carbon cycle, some chemistry and aerosols, single scenario, • science question: e.g. regional extremes • 2. Longer term (to 2100 and beyond) • intermediate resolution (~150 km), carbon cycle, specified/ simple chemistry and aerosols, new mitigation scenarios: “representative concentration pathways” (RCPs) science question: e.g. feedbacks (Meehl and Hibbard, 2007; Hibbard et al., 2007)
Decadal Prediction Experimental Design Part of an international climate change modeling activity coordinated by WCRP (WGCM/WGSIP) and IGBP (AIMES) Results from an Aspen Global Change Institute session on decadal prediction: “Climate Prediction to 2030: Is it possible, what are the scientific issues, and how would those predictions be used?” June 23-28, 2008 (co-chairs: Gerald Meehl, Ron Stouffer, Lisa Goddard, and James Murphy)
Basic model runs: • 1.1 10 year integrations with initial dates towards the end of 1960, 1965, 1970, 1975, 1980, 1985, 1990, 1995 and 2000 and 2005 • Ensemble size of 3, optionally to be increased to O(10) • Ocean initial conditions should be in some way representative of the observed anomalies or full fields for the start date • Land, sea-ice and atmosphere initial conditions left to the discretion of each group • Model run time: 300 years (optionally, an additional 700 years) • 1.2 Extend integrations with initial dates near the end of 1960, 1980 and 2005 to 30 yrs. • Each start date to use a 3 member ensemble, optionally to be increased to O(10) • Ocean initial conditions represent the observed anomalies or full fields. • Model run time: 180 years (optionally, an additional 420 years)
Choice of initial conditions is up to each group, subject to the principle that they should represent the observed anomalies for the start date. Analyses of past ocean states and/or anomalies are available. Methods to transfer such analyses into an ocean model’s initial condition exist. Most experience so far is of using observed anomalies on top of the coupled model climate, but initializing with the full state is also allowed, and will be used by some groups. • All forcings should be included as observed values for past dates, with prescribed concentrations of well-mixed GHGs. The details should be the same as used in the CMIP5 historical (20th C) runs, with the same flexibility on the treatment of ozone and aerosol and the same specified observational datasets. • For future dates, the RCP4.5 scenario should be used if possible. Specification of reactive species and aerosols will follow those used in CMIP5.
Has there been a human influence on hurricanes? It is very likely that the human-induced increase in greenhouse gases has contributed to the increase in sea surface temperatures in the hurricane formation regions. Over the past 50 years there has been a strong statistical connection between tropical Atlantic sea surface temperatures and Atlantic hurricane activity as measured by the Power Dissipation Index (which combines storm intensity, duration, and frequency). This evidence suggests a human contribution to recent hurricane activity. However, a confident assessment of human influence on hurricanes will require further studies using models and observations, with emphasis on distinguishing natural from human-induced changes in hurricane activity through their influence on factors such as historical sea surface temperatures, wind shear, and atmospheric vertical stability. --CCSP3.3 Executive Summary (2008)
What about future hurricanes? “Based on a range of models, it is likely that future tropical cyclones (typhoons and hurricanes) will become more intense, with larger peak wind speeds and more heavy precipitation associated with ongoing increases of tropical sea surface temperature. There is less confidence in projections of a global decrease in numbers of tropical cyclones.” --IPCC AR4 Summary for Policymakers (2007) “For each 1°C increase in tropical sea surface temperatures, core rainfall rates will increase by 6-18% and the surface wind speeds of the strongest hurricanes will increase by about 1-8%.” --CCSP3.3 Executive Summary (2008)
Tropical cyclone tracks from a global 20 km resolution AGCM (Oouchi et al., 2006)
Summary • North Atlantic SST variability has been associated with comparable MOC variability, and North Atlantic SSTs have been linked to hurricane activity • To address the possible role of hurricanes in the climate system, hurricanes are specified in a global coupled climate model • Hurricane winds mix heat into the thermocline, and strengthen the MOC • The combination of hurricane winds and associated torrential rainfall also mix heat into the thermocline, but weaken the MOC • The changes in MOC are small, but suggest a possible feedback of hurricanes on multi-decadal MOC and SST variability as active participants • It would be useful to predict future MOC variations, but it is unclear whether the models are up to it, or whether the relevant mechanisms are simulated • “Decadal prediction” is a new area of climate research, with the hope that an initial ocean state could capture relevant mechanisms and provide predictive skill for ten or twenty years • As part of activities to be assessed in the IPCC AR5 (2013), a decadal predictability/prediction experimental design has been proposed that would use higher resolution (about 50 km) global coupled climate models • Even higher resolution models (20 km or greater) would be desired to resolve hurricanes and explicitly study past and future changes