Download
1 / 32
320 likes | 436 Views
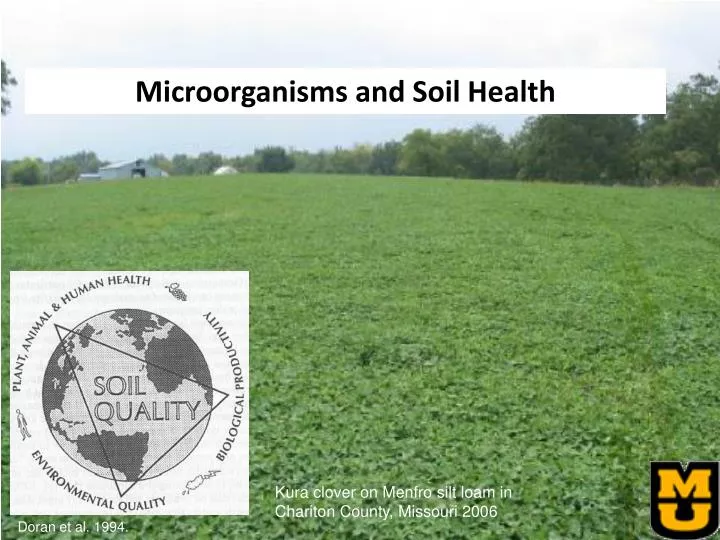
Microorganisms and Soil Health. Kura clover on Menfro silt loam in Chariton County, Missouri 2006. Doran et al. 1994. Microbial groups are associated with other soil health indicators. Active C. N min ; Nitrate, Ammonium. N min. Aggregate Stability. P mineralization, solubilization.

E N D
Microorganisms and Soil Health Kura clover on Menfro silt loam in Chariton County, Missouri 2006 Doran et al. 1994.
Microbial groups are associated with other soil health indicators Active C Nmin; Nitrate, Ammonium. Nmin Aggregate Stability P mineralization, solubilization
Microfauna (< 0.1mm), -protozoa • Mesofauna (0.1 - 2mm), - mites, collembolans, and nematodes • Macrofauna (>2mm), (oligochaetes earthworms).
Biological Attributes of Soil Health Importance: Biological activities in soils: Highly sensitive to soil-altering processes (degradative or beneficial); Changes can guide appropriate management (conservation or restoration practices in response to degradation; validation of GMP in practice) Indicators: measures that collectively suggest whether or not soil is functioning normally Development / identification of a standard set of biological soil health indicators has been elusive. Major difficulty in use organisms and activities to assess soil health = methodological.
Microbial Ecology Interactions • SOIL - Biologically dynamic system • Biological attributes interact with physical and chemical properties • Aggregate Stability • activity and products of organisms contribute to aggregation; water transport, low erosion, microbial habitat, C storage • Soil Organic Matter (C fractions) • key factors influencing biological activity and result of microbial activity, soil structure, soil fertility, plant nutrition • Soil Enzyme Activity • Soil microbial activity, nutrient transformation, decomposition; influenced by soil nutrient status, vegetation, management
Microbial Indicators of Soil Health Microbial Biomass – very general indicator Enzyme Activities Soil Respiration, N transformations (‘Greenhouse gasses’?) Microbial Characterization C Utilization Profiles Fatty acid Profiles Nucleic Acid Profiles Selected “soil fauna” *ORGANIC MATTER (CARBON) – influences many readily measurable soil functions and processes; soil microorganisms closely associated w/ “active fraction of SOM” *Aggregate Stability *Intimately related to soil biological processes No consensus in defining specific parameters for inclusion in data set for Soil Health assessment Complete data set on microbial portion of Soil Health is lacking Need: Identify minimum number of parameters that considers processes as well as community diversity for successful establishment of biotic component in determining Soil Health
Few Biological Indicators can be Field Measured -- Soil respiration (CO2 efflux) - indicator of biological activity (SQI 2001) Draeger Tube - color change shows relative amount CO2 (appropriate conversion factor(s) allow calculation of soil microbial biomass C) Microbial biomass => indicates potential ‘turnover’ rate relative to amount of N mineralized - tends to decline under degradation Solvita “Soil Life Kit” - gel indicator color change (24-hr incubation), qualitative indicator of respiration; expensive
Phospholipid Fatty Acid Methyl Ester (PFLA) • PLFA found only in living cells – PFLA profiles provide measure of soil microbial • diversity • Specific PLFA patterns detected via gas chromatography yield information on soil microbial community shifts and structure • “Peaks” indicate “biomarkers” for specific soil microbial groups http://www.microbe.com/plfa.html
Unger et al. 2013. Agroforestry Systems Carbon chain lengths of 12-20 carbons are generally associated with microorganisms. Fatty acids designated by the number of carbon atoms, followed by a colon, the number of double bonds, and then position of the first double bond from the methyl (ω) end of the molecules. Branched fatty acids are indicated by ‘i’ and ‘a’ for iso and anteiso branching, respectively.
How can Soil Microbial status of soil be expressed? • 1. “Total Living Microbial Biomass” - • ng/g, nmol or pmol units • Example: 1400 - 6700 ng/g soil for 240 Missouri soybean fields • Implications: • “Soil Microbial Biomass” • Labile (living) component of the soil organic fraction • 1 – 3% of the total soil organic C • ≤ 5% of the total soil N • Contributes to potential Nmin pool: [30 - 60 lbs/A for SOM 2.65 - 5.3%] • “activity” is mediated by the diverse soil microbial community • Involved in nutrient fluxes, decomposition, plant growth regulation • Sensitive indicator of changes in managed and natural ecosystems – major soil quality/health parameter • No indication of function or activity
How can Soil Microbial status of soil be expressed? • “Diversity Index” - • Adiversity index is a quantitative measure that reflects how many different types (such as microbial species - ‘biomarkers’) are present in sample. • Index value increases when number of types increase and evenness (how close in numbers each species in an environment are) increases. • Index value is maximized when all types are equally abundant. • Diversity index ranged from 1.5 to 3.5 for soils from 240 Missouri soybean fields (2011). • Similarity index: comparing the similarity of soils • Implications: • High of soil microbial diversity assures functional activity is near optimum • (activity of microbial ‘consortia’ in place)
Indices for describing soil microbial abundance and diversity Values reflect microbial community characteristics Diversity index (various) - assess composition diversity Species richness (abundance) - numbers of different species Species evenness - distribution of individuals within species Greater diversity => greater ability of soil to accommodate all critical functions necessary for healthy condition Certain Management (i.e., Cover Cropping, Managed Grazing, etc.) can foster Biodiversity - Reduce externalities (inputs) Reduce pollution Benefit vegetative and soil biological diversity *Use of diversity measurement in Soil Health assessment is still in flux Soil Quality (Health) concept advanced in early 1990’s Soil microbial diversity beginnings in 1980’s but is constantly evolving to present day - We have opportunity to demonstrate value of this indicator to overall soil health assessment
Soil Microbial Categories: 3. “Total Bacteria” - (ng/g; nmol/g, pmol/g, mol%) - Gram negative Overall: plant health, nutrient cycling N transformations: N2 fixation (rhizobial, endorhizal, associative) Nitrifying bacteria Denitrifying bacteria Pseudomonads - nutrient mobilization, disease suppression - Gram positive Overall: decomposition of complex organic materials (relative to Gram -) stress resistance Actinobacteria - disease suppression (antibiotic synthesis); residue decomposition - Anaerobic bacteria function in saturated microenvironment - denitrification, sulfate reduction; Indicators of soil compaction or aeration problems - related to DB values
Soil Microbial Categories: 4. “Total Fungi” - (ng/g; nmol/g, pmol/g, mol%) - Overall: Decomposers of most complex organic substrates and xenobiotics Ammonification Soil aggregation Pathogen suppression - Mycorrhizal fungi - plant symbiosis; mineral and organic P mobilization & transport to plant; improves root water uptake (impart drought resistance to plant); mineralize N, S, K; Pathogen suppression; ‘Glomalin’ deposits in rhizospheres are critical sinks for C storage and for stable soil aggregation Faculty of Biology Genetics, University of Munich
Soil Microbial Categories: 5. “Protozoa or Protists” - (ng/g; nmol/g, pmol/g, mol%) - Overall: Nutrient cycling - Predatory - ‘microbial turnover’ - mineralize organic, microbial N maintains balanced microbial community
Soil Microbial Categories: 6. Algae - (ng/g; nmol/g, pmol/g, mol%) - Overall: Nutrient cycling; photosynthesis (C supply to soil and microbial community); extracellular polysaccharides bind soil particles, increase aggregate stability, formation of erosion-resistant soil crusts; food source for predatory protozoa, nematodes - ‘microbial turnover’ Nostic sp.
Soil Microbial Categories: 7. Nematodes Important in regulating bacterial and fungal communities; cycle N; primary decomposers of coarse organic materials Location of symbiotic bacteria in intestines of their respective nematode hosts. (A) Xenorhabdus nematophila cells located in the intestinal vesicle of Steinernema carpocapsae infective juveniles. (B) Photorhabdus luminescens cells located in the anteriors and midintestine of Heterorhabditis bacteriophora nematodes. The bacteria are denoted by arrows.
Soybean Cyst Nematode Eggs Stylet (feeding structure) Cysts on soybean root Cysts on Roots SCN egg attacked by soil fungus
Soil Microbial Categories: 8. Soil Insects – Microarthropods Fragment coarse organic residues, preparing it for subsequent decomposition by microbes; aid soil structure; feed on plant pathogenic fungi “Microarthropod” – Collembola – “springtail” ≤ 2.0 mm length
Soil Microbial Categories: 9. Earthworms Fragment coarse organic residues, preparing it for subsequent decomposition by microbes; aid soil structure by increasing porosity and aggregation; concentrates soil N and P in castings; provides gut habitat for microbes involved in mineral cycling; **Sensitive to changes in soil management
Soil Microbial Categories: 10. “Fungi-Bacteria Biomass Ratio” (F:B) - Implication: Ratios reflect ecosystem: F:B = 0.3:1 - 0.8:1 => row crops, vegetables = 10:1 - 50:1 => orchards, woody plants Fungi may be associated with higher soil NH4; Bacteria associated with high soil NO3 Certain plants favor specific type of N i.e., woody plants – NH4 annual plants - NO3 Willow prefers N as NH4
Soil Microbial Categories: 11. “Stress Ratios” - i.e., monounsaturated PLFA : polyunsaturated PLFA or “saturated PLFA : monounsaturated PLFA” higher ratio suggests microbial community subjected to some stress; may include plant stress
Microbial diversity components for management practices on claypan soil, Novelty, MO - 2009 (Buffers established in 1997) *Microbial biomass did not differ significantly among management practices Unger et al. 2013. Agroforestry Systems 87:395-402.
Soil Enzyme Activities as Indicators of Soil Quality Enzyme activities seem to be sensitive in discriminating among soil management treatment effects – more dynamic measure vs SOM Long-term Cropping Sites Rotations Tillage Systems Forest ecosystems -- little effort Clear-cut sites -- phosphatase activity decreased under compaction vs 'rehabilitated site' Phosphatase activity inversely proportional to Bulk Density Suggest soil enzyme activity used by forest managers to identify beneficial management practices before investigating subsequent tree growth Selected Soil Enzymes — potential SQ indicators **Enzymes representing critical soil biological processes should be selected Enzymes procedures simple, rapid, can be routinely performed - IN THE LAB Sensitive to temporal changes in soils due to environment or management Information of long-term effects of management can be provided
Example of activity indicator detecting change due to management well in advance of SOC indicator
Relationship of soil microbial activity to SOC content in Sharpsburg silt loam Organic farm site in Clay County, MO - SOM annually built up thru organic amendments Continuous vegetative cover Tilled, not managed Kremer & Hezel, 2013. Renewable Agric. & Food Syst. 28:245-254. Expect relationship to improve using specific C fractions vs broader SOC values
Management Inferences from Soil Health Analysis Mycorrhizae Cover crop composition (mix) stimulates soil mycorrhizae populations for colonization of subsequent cash crops PLFA biomarker for mycorrhizae Lehman et al., 2012