Download
1 / 25
250 likes | 377 Views
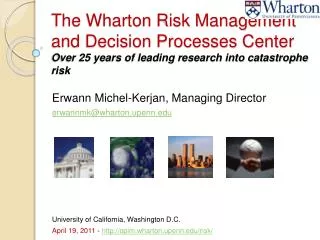
The Economics of Extremes: Toward an Integrated Management Framework and Some Research Applications. Jeffrey Czajkowski Wharton Risk Management and Decision Processes Center Willis Re Research Fellow Workshop on Statistical Applications to Climate Extremes October 2 9, 2012.

E N D
The Economics of Extremes: • Toward an Integrated Management Framework and Some Research Applications Jeffrey Czajkowski Wharton Risk Management and Decision Processes Center Willis Re Research Fellow Workshop on Statistical Applications to Climate Extremes October 29, 2012
Traditional Modeling of Catastrophic (Extreme) Risks – Risk Assessment Hazard Vulnerability Loss Exposure 2 Source: Grossiand Kunreuther 2005
The Role of Economics Proper (economic)loss accounting:direct, indirect, geographical & time aspect Given 1), empirically estimating key drivers of loss: hazard, exposure, vulnerability. Modeling and understanding decision making in this extreme weather context: rational and “irrational” Implementation and evaluation of appropriate risk management strategies to ultimately reduce risk:information (e.g., forecasting), economic incentives, regulation & standards, insurance, disaster assistance, etc.
1) Hurricane Loss Estimation (joint with NCAR) • Hurricane Damage = f(wind speed[3-9]) • Damage typically direct property losses in impacted coastal counties- insured and uninsured • When damage normalized, account for wealth (national), population and/or housing unit (coastal county) increases • Estimates used as a basis to project damages into the future under climate change scenarios • Integrated case study approach to Hurricane Damages: • For example, Hurricane Ivan (2004) vs. Hurricane Dennis (2005) • Similar landfall maximum wind speed at same general landfall location, but dissimilar damages - $14.2 vs. $2.2 billion – why? 4
Defining the Hurricane Impacted Areas • Size matters – 228 vs. 21 hurricane force impacted census tracts • Location matters – hurricane force impacts not limited to coastal counties, nor is there 100% impact within in each affected county 5
Assessing Losses – Access to Data Critical • Property losses are not limited to residential structures - personal (65-70%), commercial (25-30%), auto (5-10%) – is this variation accounted for in normalization or estimation? • Property losses are not limited to hurricane impacted areas, nor general landfall states: • For example in Ivan, while 85% of total damage in FL AL, a billion dollars in damage outside of these two states – should we account for this in the modeling? 6
Impacts of Tropical Cyclones not limited to wind: 2) Flood Ratio as Hazard Proxy (Princeton & Iowa) Hurricane Ivan Rainfall Data Hurricane Ivan Flood Ratio Data
Translation of quantified flood magnitudes into economic losses: non-surge NFIP claims A total of 19,273 claims with $800.9 million in flood damages related to inland flooding losses – or two-thirds of the total NFIP flood residential insurance claims and more than half (54 percent) of the total residential flood damage 1,241 census tracts highlighted in pink had at least 1 NFIP claim: inland areas match relatively well to the regions with a large flood ratio, in particular along the Appalachian Mountains and in Pennsylvania
Census Tracts with no NFIP policies in-force • 6,940 census tracts highlighted in pink had no 2004 NFIP policies in-force • 498 (7%) of these tracts had a flood ratio greater than the 10-year flood peak value – majority in PA, TN, and NC (85% of the 498)
Quantification of Flood Ratio to Loss – number of claims incurred • The raw data illustrates an upward trend in the average number of claims per census tract for higher flood ratio values • The preliminary empirical results indicate flood ratio is a statistically significant and positive driver of not only the probability of a claim occurring, but also the number of claims an average tract incurs
3) Earl, Irene, and Isaac: a Natural Decision Making Experiment (joint with FSU) Isaac (2012) Irene (2011) Earl (2010) Survey residents (by phone) in areas threatened by hurricanes 3-4 days before the storm arrives Hope: To understand what drives decisions to invest in protection from storm threats (one way to reduce losses) as they are being made
However … most short-term preparation tended to that requiring limited effort
More disturbing: evacuation compliance low even among those who said there was a high chance of surge flooding (Isaac)
Preliminary Decision to Evacuate Multivariate Results:Irene & Earl
4) U.S. Hail Risk & Losses • From the Storm Prediction Center (SPC) data archive – 203,665 hail stormsfrom 1996 to 2011– or, approximately 13,500 hail storms per year • According to a CDS/Risk Meter report, 44% of the country is at average hail risk or above(2-3 hailstorms per year on average) • Losses can be significant • U.S. property insurers pay out an average of $1.5 billion each year for hail-related claims • The Kansas City hail storm on April 10, 2001 was the costliest hail storm in the U.S. which caused damages of an estimated $2 billion
What can be done to reduce these hail losses? • One well-encouraged notion is to vigilantly and vigorously promote and support advanced building codes • Unfortunately, many states - such as Missouri - have no statewide building code in place, i.e., the codes are left up to individual municipalities in that state • Further, even if a statewide code did exist, not all jurisdictions equally enforce their codesonce they have been adopted • Building Code Effectiveness Grading Schedule (BCEGS) – lower rating = better enforcement
MO Average Zipcode BCEGS Rating Geographic Distribution BCEGS < = 4 BCEGS > = 5 BCEGS not rated
Results Summary – Dependent variable natural log of damage per zip code “The concept is simple: municipalities with effective, well-enforced codesshould demonstrate better (all peril) loss experience” (ISO BCEG Summary) • Better BCEGS ratings do in fact reduce hail damage • “Low” BCEGS ratings are statistically significant estimators of reduced hail losses in comparison to high and unclassified BCEGS • Still, it is better in general to have some rating than no rating • Can begin to quantify the value of obtaining an improved rating
Traditional Modeling of Catastrophic (Extreme) Risks – Risk Assessment Hazard Vulnerability Loss Exposure Comprehensive and Integrated Framework? • One-way relationships • Non-distinguishable scales • Spatial • Time • Role of: • Behavior / Risk Perception • Uncertainty • Primarily utilized for industry purposes 23 Source: Grossiand Kunreuther 2005
Integrated Modeling and Management of Extreme Risks • Dotted arrows and boxes indicate relationships or concepts for which knowledge or data are lacking, uncertainty is high, or key issues need be addressed • Multiple boxes in coping and adaptation represent the need for diverse strategies, flexibility, and possible mid-course adjustments given uncertainty • Over the long term, vulnerability is also influenced by the outcomes from previous weather extremes, and coping and adaptation can influence macroscale drivers • Scientific information is influenced by macroscale drivers, influences coping & adaptation strategies BEFORE DURING AFTER 24 Source: Morss et al., 2011
Thank You – Questions? For more information on theWharton Risk Management & Decision Processes Center http://www.wharton.upenn.edu/riskcenter/