Download
1 / 46
460 likes | 476 Views
This study examines the systematic issues and presents the evidence for a narrow spectral feature near 130 GeV near the Galactic center. The optimized region of interest and improved energy resolution model are discussed. Data reprocessing with updated calibrations and flux upper limits are also presented. The significance of the spectral excess and its morphology are analyzed. Systematic effects and instrumental considerations in studying narrow spectral features are discussed.

E N D
Fermi-LAT Line Search, Systematic Issues and the 130GeV Feature Eric Charles on Behalf of the Fermi-LAT Collaboration Aspen Winter Conference Jan. 31 2013
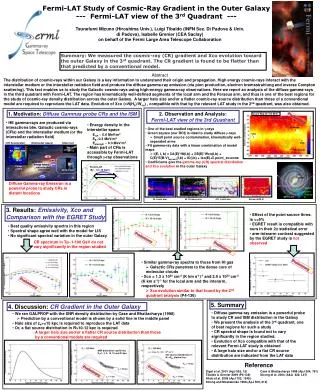
The Context: Narrow Feature at 130 GeV f= 0.34 Bringmann+ [arXiv:1203.1312] Weniger [arXiv:1203.2797] f = 0.41 Fractional Residual (i.e., S/N): f = s2 / ns • Bringmann et al. and Weniger showed evidence for a narrow spectral feature near 130 GeV near the Galactic center (GC). • Signal is particularly strong in 2 out of 5 test regions, shown above. • Over 4s, with S/N > 30%, up to ~60% in optimized regions of interest (ROI). • Some indication of double line (111 &130 GeV).
Optimizing the Region of Interest (ROI) • Optimize ROI for a variety of DM profiles • Find RGC that optimizes sig/sqrt(bkg) • Search in 5 ROIs • R3 (3° Circle) • R16 (Einasto Optimized) • R41 (NFW Optimized) • R90 (Isothermal Optimized) • R180 (DM Decay) RGC 10° 12°
Improved Energy Resolution Model • Use full detector simulation to get Fermi LAT energy dispersion. • Previously modeled line with a triple Gaussian fit (“1D PDF”). • Updated analysis adds a 2nd dimension to line model: PE. • PEis the probability that measured energy is close to the true energy. • “2D PDF” (a function of both energy and PE). • Break Line into 10 PE slices and do triple Gaussian fit in each slice. • Similar to public IRF description, which uses cosq instead of PE • Including PE → ~15% improvement to signal sensitivity (when there is signal) and counts upper limit (when there is no signal).
Data Reprocessing with Updated Calibrations Event Overlap v. Energy Energy Shift v. Time Preliminary Preliminary • Reprocessing Data with updated calibrations (primarily Calorimeter). • Improves the CAL/TKR agreement at high E, improving the direction resolution. • Corrects for loss in CAL light yield b/c of radiation damage (~4% in mission to date) whichcorresponds to a slightly larger change in the energy scale at 130 GeV. • 80%+ overlap in events between original and reprocessed samples. Spectral feature has shifted to 135 GeV because of the slight shift in the energy scale of the instrument.
Fermi-LAT Line Search Flux Upper Limits S/N < 4% Bands show statistical uncertainties only • Most of the limits fall within the expected bands. • Near 135 GeV the limits are near the upper edge of the bands. • The huge statistics at low energies mean small uncertainties in the collecting area can produce statistical significant spectral features.
Fermi-LAT Team Line Search at 135 GeV • 4.01σ (local) 1D fit at 130 GeV with 4 year unreprocesseddata • Look in 4°x4°GC ROI, Use 1D PDF (no use of PE)
Fermi-LAT Team Line Search at 135 GeV • 4.01σ (local) 1D fit at 130 GeV with 4 year unreprocesseddata • Look in 4°x4°GC ROI, Use 1D PDF (no use of PE) • 3.73σ (local) 1D fit at 135 GeV with 4 year reprocessed data • Look in 4°x4°GC ROI, Use 1D PDF (no use of PE)
Fermi-LAT Team Line Search at 135 GeV • 4.01σ (local) 1D fit at 130 GeV with 4 year unreprocesseddata • Look in 4°x4°GC ROI, Use 1D PDF (no use of PE) • 3.73σ (local) 1D fit at 135 GeV with 4 year reprocessed data • Look in 4°x4°GC ROI, Use 1D PDF (no use of PE) • 3.35σ (local) 2D fit at 135 GeV with 4 year reprocessed data • Look in 4°x4°GC ROI, Use 2D PDF (PEin data) • <2s global significance after trials factor
Location of Spectral Excess Signal significance in fit to powerlaw + 1D signal PDF at 135 GeV for 4°x4° boxes near the Galactic Center in 1° steps. 4 Years Data, P7_REP_CLEAN, qz < 100° E=[~50,~200GeV] Significant (3-4s+) excesses near the Galactic center. Largely within 4° of Galactic plane. (However, be wary of interpretation in view of limited statistics…)
Slicing Along the Plane Preliminary At 135GeV the excess near the Galactic Center might have structure. (Again, be wary of interpretation in view of limited statistics). Features at ±10° maybe be noise, but they are similar in same size as the feature at the GC. Signal significance in fit to powerlaw + 1D signal PDF at 135GeV for 4°x4° boxes along the galactic plane.
Morphology of “Two-Line” Excesses Preliminary The 111GeV feature is not as strong as the 130GeV feature, and does not appear to be spatially correlated with it, expect perhaps in the 4°x4° ROI nearest the Galactic center.
Systematic Effect to Consider It is difficult to disentangle the three final cases when only looking at events in the final sample. Decreased Aeff near Epeak is particularly challenging, as the events of interest are not in the final sample. We have also considered many other effects: e.g., point source masking, simulated effects not captured in IRFs, data/ MC comparisons of selection variables, etc… See also: [arXiv:1209.4548], [arXiv:1209:4562].
Instrumental Considerations in studying narrow Spectral Features
Observing Profiles Variations Averaged over years, the observing profile depends primarily on the DEC of the Region of Interest (ROI). The Galactic Center gets somewhat more time right on-axis than other sources (and less time slightly off-axis). This is because DECGC ~ Inclinationorbit
q-averaged Energy Resolution by Declination The q-averaged PDF weighted for observing profile varies moderately with declination. Using the wrong profile will not induce a signal, but can scale the significance of a signal by up 25%. This suggests using a 2 dimensional PDF, which increases statistical power by ~15%.
Cosmic-ray Background Contamination E > 100 GeV Sky Survey Data 4 years Preliminary • ~ 0.85 (In g-ray rich Galactic Plane) • purityhigh_b~ 0.25 (Comparison of regions) Above 100 GeV most of the high-latitude events in P7SOURCE that are not in P7CLEAN are not g rays. CR-background reconstructed as g rays will show a variety of spectral features, which can corrupt and compromise the sideband fit as well as induce fake signals.
Background Contamination Rates P7CLEAN P7ULTRACLEAN P7SOURCE ApJS, 203, 4. [arXiv:1206.1896] Comparing P7SOURCE fits for small ROI in the galactic plane to large ROI where the P7SOURCE class is dominated by CR background is dangerous. For very large ROI the residual contamination in the P7CLEAN class may becoming noticeable, but this is not an issue for small ROI near the GC, and is not causing the feature seen at 130GeV.
The Earth Limb as a Control Sample Boresight θrock θi Zenith θz γ ray Cosmic ray Sky Survey Mode, qrock = 52° Limb at qrz= 112° Limb:qi > 60°
Measuring Efficiency with the Earth Limb Preliminary E [50,200] GeV Sky Survey Data Rocking angle cut reversed ABS(ROCK_ANGLE)>52 The Earth Limb is unique in that it can be seen in the loose P7TRANSIENT event class at high energies. This allows us to use it to measure efficiencies for tighter event classes as a function of energy.
P7TRANSIENT to P7CLEAN Efficiency Preliminary Same data as previous slide These dips in efficiency appear to be related to the CAL-TRK agreement. Points: Flight Data Curve: MC 130GeV The efficiency at ~115Gev is 0.57/0.75 = 75% of the MC prediction. This would imply a 30% boost in signal at 130 GeVrelative to the prediction from nearby energy bins.
Fitting the Earth Limb Preliminary The fit to Earth Limb data results in a 3.0s signal, with a fractional residual (i.e., S/N) of ~18%.
Earth Limb Residuals as a Function of Energy Preliminary 130GeV Lower Statistics Fits to Earth Limb data at ~1.5% energy steps The limited statistics at high energies make it difficult to exclude large fractional residuals. At 130GeV we see S/N~18% and 3.0s significance residuals.
Signal to Noise of Excess as a function of q 8°x8° box around GC 12°x12° box around GC Limb Galactic center Many people have noted that the spectral excess in both the the GC and the earth limb is largest near cos(q)=0.7. By comparing the fractional residuals we see that the features in the Earth Limb could account for about 50% of the excess in a 12°x12° box around the GC, but only about a 30% of the excess in a smaller 8°x8° box where the feature is brighter.
Pass 8 Event Reconstruction Improved TKR and CAL reconstruction algorithms mitigate issues with CAL /TKR agreement, help avoid features in Aeffcurve. Expect ~25% increase in acceptance above ~10 GeV from using improved reconstruction information for event selection. Expect better energy resolution at high energies from improved shower profile fitting. Pass 8 event analysis, nearing completion and expected in 2013 will substantially improve our prospects for answering questions about the spectral feature at 130 GeV.
Summary • Spectral feature at 130 GeV near the Galactic center is a potentially interesting hint of Dark Matter annihilation • Fractional residual up to 60% in 4°x4° box around GC • Not caused by background contamination • A similar spectral feature is seen in the Earth Limb and is likely attributable to dips in efficiency at energies just above and below 130 GeV • The Earth Limb instrumental features are not enough to explain all of the feature near the GC, however when accounted for they reduce the significance of the GC feature by up to 30%-50% depending on the ROI under consideration. • Data have been reprocessed with updated CAL calibrations • Signal significance somewhat lower (~3.5slocal) • No longer globally significant (< 2s global)
Performance Variation with Incident Angle (q) Containment within 10% of Etrue Aeff(cosq) at 130GeV Front Back Front Back Because of the shape of the LAT, the g-ray incident angle q is the key parameter for performance. Changing resolution with qimplies that cutting on a Energy band to identify signal events will shape the distribution in qand increase the “mistag” rate of between signal and background. See [arXiv:1208.3677] for a better method.
Where are we most sensitive to a narrow feature Preliminary Out to about q=50°, the improving energy resolution balances out the decreasing Aeff. Less sensitivity past q=60°. Toy MC simulations for a range of signal-to-noise ratios favor energy resolution over Aeffslightly less than naïve scaling predictions.
Zenith Cuts Shape the Observing Profile Standard zenith angle selection reduces the amount of observing time away from the boresight because the LAT tends to point away from the Earth.
“Effective Background” Signal and Bkg. PDFs Signal Weight v. Energy Preliminary Preliminary Signal Weight: Ws(E) = Ps(E) / ( Ps(E) + Pb(E) ) “Effective Bkg”: Nbkg,eff = Nevt § Pb(E) Ws(E) dE Significance: S = Nsig / sqrt(Nbkg,eff ) Fractional Residual(i.e., S/N): F = Nsig / Nbkg,eff To consider instruments effects it is useful to look at the potentially induced fractional residual (i.e., the Signal-to-noise ratio).
Event Selection Cuts The two cuts in redappear to account for most of the difference between Earth Limb data and MC at high energies.
Acceptance of Event Classes Acceptance v. Energy Events Rates over a Day ApJS, 203, 4. [arXiv:1206.1896] Above a few GeV: P7TRANSIENT class primarily rejects poorly reconstructed events and events which fail the ACD analysis due to backsplash from the CAL with very loose cuts on CAL and TKR topology. P7SOURCE, P7CLEAN and P7ULTRACLEAN class make more use of the TKR and CAL and reject MIP-like events, events that look more like hadronic showers, and events with poor CAL/TKR agreement.
Observing Profile of the Earth Limb The observing profile for pointed-mode data, with the standard rocking angle cut reversed: (ABS(ROCK_ANGLE)>52) is similar to the GC for larger off-axis angles, but under-represents angles near the boresight. Note a scaling factor of > 400 between the observing times in the two samples.
CAL/TKR Agreement, High Energy PSF, etc.. CalTrackAngle: angle between CAL axis and TKR direction CalTrackDoca: Distance of Closest Approach (DOCA) between track and CAL centroid PCORE: Probability that event is within the CORE of the PSF Above ~10GeV the backsplash from the CAL causes many hits in the TKR and increases the probability of picking the wrong hit for a track and pulling the track direction well into the tails of the PSF. We use the TKR /CAL agreement to mitigate this and also to reduce CR background.
Data / Monte Carlo Comparisons P7SOURCE E > 120 GeV Limb Data Monte Carlo P7SOURCE E > 120 GeV Limb Data Monte Carlo Detailed comparisons between flight data and Monte Carlo simulations show that the CAL/TKR agreement is somewhat worse in the flight data than in the simulations. These two variables are among the most important in the Classification Tree analyses used for event selection and classification.
Fitted Excesses Along the Plane at 89GeV Preliminary The significance distributions look like noise with a few noticeable features of marginal significance (e.g.,l,b= -28°,-4°). Signal significance in fit to powerlaw + 1D signal PDF at 130 GeV for 4°x4° boxes near along the Galactic plane in 1° steps.
Fitted Excesses Along the Plane at 130 GeV Preliminary The excesses near the GC at 130 GeV are among the largest seen at any energy at the 4°x4° scale, and stand out particularly at 8-16° scales. Integrating the Galactic plane outside ±10° shows no excess at 130 GeV.
Distribution of Significances 4°x4° ROIs, 1° Steps 8°x8° ROIs, 2° Steps Preliminary Preliminary Distribution of significances for all ROI centered within a 20°x40° around the Galactic center. Signal energy scanned in 0.25s steps between 65 and 500 GeV and ±6s fit windows. Fits are to a powerlaw + 1D signal PDF. The red histogram shows fits using data with shuffled energies. The black histogram is flight data. The blue curve is a fit to the shuffled data. In both cases it is consistent with a unit width Gaussian with mean zero. As stated earlier, the excess at 130GeV is among the largest seen at any energies, and stands out from the distribution at 8° to 16° scales.
CAL Temperatures During Early Orbit Load Shed & Recovery 2 Orbit Pole Pointing Power-on LAT CAL Temperatures [°C] Pole Pointing causes small, but noticeable thermal excursions in the CAL. We expect these to cause only a ~1% change in energy scale, but pedestal shifts may increase noise in CAL. Pole Pointing Date [UTC] Commissioning data used slightly different configurations, and original processing had poor CAL intra-range calibrations.
CAL Temperatures During Survey Mode 5 Hour ARR 5 Hour ARR CAL Temperatures [°C] Temperatures are very stable during Autonomous Re-point Requests (ARR). Reboot & Thermal Fault Date [UTC]