Download
1 / 26
260 likes | 387 Views
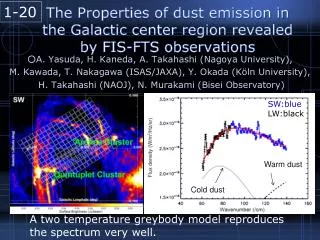
Dust Properties Retrieved from the AERI Observations at Niamey. Dave Turner Space Science and Engineering Center University of Wisconsin - Madison. Overview. Atmospheric Emitted Radiance Interferometer General description of instrument Calibration approach Data corrections needed

E N D
Dust Properties Retrieved from the AERI Observations at Niamey Dave Turner Space Science and Engineering Center University of Wisconsin - Madison
Overview • Atmospheric Emitted Radiance Interferometer • General description of instrument • Calibration approach • Data corrections needed • Scaling radiosonde humidity profiles • Dust retrieval method • Results • Importance of the dust microphysical and optical properties to the (infrared) forcing? • Are the dust properties a function of either the diurnal cycle or season?
Atmospheric Emitted Radiance Interferometer (AERI) • Automated instrument measuring downwelling IR radiation from 3.3-19 µm at 0.5 cm-1 resolution • Uses two well characterized blackbodies to achieve accuracy better than 1% of the ambient radiance • Non-linearity correction well-known • Data used in a wide variety of research • During AMF NIM deployment, AERI collected 3-min avg every 8 min • Knuteson et al. JAM 2004 (2 papers)
AERI Interferometer Assembly Front End Assembly IR Detector Dewar with Cooler Cold Finger Blackbodies Scene Mirror Assembly Forced Air Inlet Rain Sensor Sun Sensor ABB Stirling Cooler Compressor HBB Bomem Interferometer Front-end Closeout (thermal) Optics Bench Shock Mounts (4) Interferometer / AERI Electronics Interface Box Knuteson et al., JTECH, 2004
Calibration Targets (Blackbodies)are Key to Accurate Radiances Emissivity > 0.999
Updated Calibration and Correction • Discovered after NIM deployment that the spectral calibration (stretch factor was slightly off) • Easy correction to determine and apply via post-processing • Very little uncertainty in this correction • AERI observations are always slightly warmer than LBLRTM clear sky calculations • Easiest to observe in low PWV conditions • Observed with all AERI systems (SGP, NSA, etc), albeit with slightly different magnitudes • Only important for clear sky research OR retrieval of properties from optically thin layers (like dust) • Believe that there is a small obscuration in FOV or that there is some contribution from scattering inside interferometer • Model this as an obscuration: Fv= (Nobs - Nsky) / (B(Teff) - Nsky) where Nsky is a clear sky LBLRTM calculation in “dust-free” conditions. Fv ~ 0.01 for NIM
Impact of Corrections • Identified 6 cases, manually identified to have “negligible” AOD, to characterize both and Fv • Cases from 2 May, and 23-26 Dec • Plan on using AMF data in Germany to verify adequacy Residuals with original observations Observed minus Calculated Residuals with corrected observations
Importance of Water Vapor • Water vapor contributes a significant portion of the downwelling IR signal in the 8-13 µm band • Critical that the water vapor be correctly specified before dust properties can be retrieved from the AERI observations • Used interpolated radiosondes, where the water vapor profile has been scaled (height-independent factor) to agree with the microwave radiometer PWV • This last factor is critical, as Vaisala radiosonde humidity observations have a well-known diurnal bias (daytime approximately 6% to 8% drier than nighttime sondes for RS-90/92 sondes)
Dual Sonde Launch ExamplesVaisala RS-80H 1996 WVIOP 1997 WVIOP Calibration differences between radiosondes appear to act as height-independent scale factors in the lower troposphere! Revercomb et al., BAMS, 2003
AERI / LBLRTM Results • Using height-independent nature of the radiosonde calibration differences, the sonde humidity profiles were scaled to agree with the MWR in PWV • LBLRTM runs were made with both the unscaled and scaled radiosondes • Model runs made with the scaled results show 2 times less variability than the unscaled sonde results Turner et al., JTECH, 2003
Using the AERI / LBLRTM Results to Look into the “Diurnal Issue” • Unscaled sonde results show significant diurnal differences, both in mean value and standard deviation • Scaled sonde results are virtually identical both day and night • Radiosondes have a considerable diurnal difference Turner et al., JTECH, 2003
Microwave Radiometer Retrievals (MWRRET) • New algorithm to retrieve PWV and LWP from the ARM Microwave Radiometers (MWRs) • Uses both a physical-iterative and an advanced statistical retrieval • Physical retrieval only applied at radiosonde launch times • Statistical retrieval, which uses surface P/T/U data to estimate the retrieval coefficients, is then tuned to the physical retrieval • MWRRET algorithm accounts for biases in the observed brightness temperatures; if not accounted for, then physically unreasonable LWPs exist • MWRRET dataset processed for NIM and in ARM archive (PI products section) Turner et al., IEEE TGRS, in press
MIXCRA • Developed to retrieve simultaneously the properties of both the liquid and ice particles in a mixed-phase cloud from AERI observations • Optical depth and effective radius of both components • Optimal estimation used to propagate uncertainties in observations and sensitivity of forward model to provide uncertainties of retrieved solution • Turner, JAM, 2005 • Scattering properties are provided to algorithm via a lookup table, so I am able to retrieve dust properties simply by exchanging the ice/liquid tables with dust tables • Different “phases” must have different absorption bands • Modeled the dust as spherical particles with a lognormal size distribution • Adequate for 8-13 µm band, not for 3-5 µm band
More Examples • Dust assumed to be pure kaolinite in this example • Obs / calc fits are impressive, but not perfect across the bands; incorporating a second mineral improves fit to obs • Clear sky calcs show significant IR surface forcing
Approach • Downwelling IR radiance is sensitive to dust composition, optical depth, and effective radius • To detect differences in composition, each mineral must absorb in different spectral regions • Able to distinguish between quartz, kaolinite, and gypsum using IR data • Performed 6 sets of retrievals on manually identified cloud-free periods • Quartz-only, kaolinite-only, gypsum-only • Quartz+kaolinite, quartz+gypsum, kaolinite+gypsum • Retrieval with the best statistical fit for each sample was identified • Results analyzed as function of season and local meteorology
Infrared Spectral Signaturesof Different Mineral Types Quartz absorbs here (not Kaolinite or Gypsum) Kaolinite absorbs here (not Quartz or Gypsum) Gypsum and Quartz absorb here (not Kaolinite)
Wind Direction and Water Vapor at ARM Site in Niamey Early monsoon Late monsoon Pre-monsoon Post-monsoon
Occurred most frequently during the year Episodes of high optical depth in three periods Late Monsoon Pre-Monsoon Early Monsoon Post-Monsoon Dust Optical Depth and Composition Distribution Distribution for entire year
Kaolinite-only was best fit frequently during late monsoon period, not for pre/post-monsoon periods Significantly different distribution of kaolinite+gypsum vs. kaolinite+quartz for the four periods Dust Optical Depth and Composition Distribution
Distribution of Effective Radius Per Period Kaolinite Quartz and Gypsum
Kaolinite Fraction forEach of the Periods • Kaolinite fraction defined as Fk = k / total • Fk significantly different for Kaolinite+Gypsum in the pre-monsoon and post-monsoon periods • Quartz becomes more dominant (relatively) during the early- and late-monsoon periods
Summary • Retrieved infrared optical depth, effective radius, and dust composition from AERI observations at NIM • Only used observations from 8-13 µm, and assumed the dust particles to be spherical • Dust assumed to be kaolinite, quartz, gypsum, or some combination of any two • Only applied to observations that were manually identified as cloud free • Kaolinite is the dominant component of dust for entire year, with 66% of observations are best satisfied by a combination of kaolinite + gypsum and 23% best satisfied with a combination of kaolinite + quartz • Kaolinite fraction changes significantly during the 4 periods in 2006. The changes are likely associated with land-use changes associated with the precipitation cycle dturner@ssec.wisc.edu