Download
1 / 60
610 likes | 728 Views
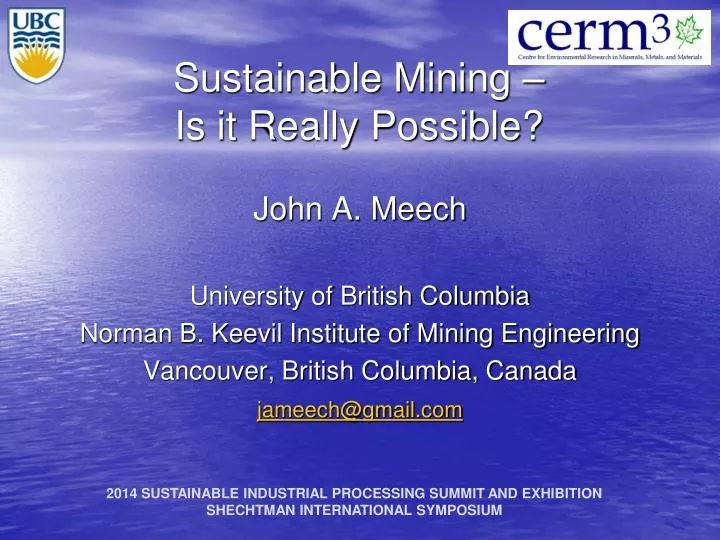
Sustainable Mining – Is it Really Possible?. John A. Meech University of British Columbia Norman B. Keevil Institute of Mining Engineering Vancouver, British Columbia, Canada jameech@gmail.com.

E N D
Sustainable Mining –Is it Really Possible? John A. Meech University of British Columbia Norman B. Keevil Institute of Mining Engineering Vancouver, British Columbia, Canada jameech@gmail.com 2014 SUSTAINABLE INDUSTRIAL PROCESSING SUMMIT AND EXHIBITIONSHECHTMAN INTERNATIONAL SYMPOSIUM
"The test of our progress is not whether we add more to the abundance of those who have much; it is whether we provide enough for those who have too little." - Franklin Delano Roosevelt 2014 SUSTAINABLE INDUSTRIAL PROCESSING SUMMIT AND EXHIBITIONSHECHTMAN INTERNATIONAL SYMPOSIUM
CERM3 Mission Statement • Foster high regard for Sustainable Miningpractices and concern for the environment • Develop innovative methods to ensure the future sustainability of the Mining Industry • Train the next generation of Mining and Processing Engineers for the 21st Century • Improve the image of Mining in society 2014 SUSTAINABLE INDUSTRIAL PROCESSING SUMMIT AND EXHIBITIONSHECHTMAN INTERNATIONAL SYMPOSIUM
Papers and Topics • Suzette McFaul: creating small businesses in mining communities • Chris Anderson: Phytoextraction in developing countries • Jessica Wang: Remining Old Tailings Dams • Gustavo Angelosi: Changing Habits of Artisanal Miners • Ladan Mohammadi: Confined Spaces Issues • Mory Ghomshei: High-temperature Geothermal Energy in Canada • Ricky Gu: Bitcoin – the "New Gold" for a Safe-haven investment • Sixto Aguero: Energy Use in Cement Production • John Meech: Fuzzy Logic for decision-making • Peipei Shi: Phytomining PGMs • André Xavier: First Nations Issues in Canada
UBC-CERM3 at Britannia Beach Britannia Beach UBC-CERM3 has been involved at Britannia Beach since 2001 when we installed a plug inside the 2200 Level tunnel to create a research facility. This plug had the “spin-off” benefit of eliminating all pollution flowing into Britannia Creek and the surface waters of Howe Sound.
Reclamation Issues in 2001 • Acid mine drainage from tunnels (620 m3/hr) - ~800 kg of Cu & Zn /day • Over 10,000 tonnes of metal since closure • Groundwater contamination on the Fan - impacts on aquatic life • Waste dumps and stockpiles and tailings at bottom of Howe Sound • Public safety - sealing abandoned adits, demolition of derelict buildings
Millennium Plug Research Project Pollution Plume – pre 2001
Some people like to drink the Britannia Creek water and it is now safe to do so, although like all natural water streams in the wild, it is not recommended without prior chemical treatment.
Outcome – September 2011 Return of Adult Pink Salmon to Britannia Creek Numerous Media Reports
EPCOR Water Treatment Plant Started up December 2005 Capital Cost = ~ $12.0M Operating Costs = ~ $ 1.5M
Revenue Generation Potential 187.0 tonnes per year of contained copper Cu Concentrate 51.1% Cu, 2.1% Zn, 0.24% Fe, 33.1% S 185.5 tonnes per year of contained zinc Zn Concentrate 52.4% Zn, 1.5% Cu, 0.3% Cd, 0.8% Fe, 27.1% S Combined Annual Value = $615,000 net smelter return Potential Cladding Material Value = $895,000 from sludge Metal Recovery Plant Capital Costs = $2,500,000 to $4,500,000 Additional Benefits Value = $64,000 per year Lime Savings (32%) Value = $13,600 - $18,000 Sludge Reduction (15-20%) 2014 SUSTAINABLE INDUSTRIAL PROCESSING SUMMIT AND EXHIBITIONSHECHTMAN INTERNATIONAL SYMPOSIUM
Aspects of Sustainable Mining Sustaining The Company The Environment The Communities Technical-economic Issues Environmental protection and remediation Creating happy, productive communities occupational health and safety preventing or mitigating emissions and impacts providing employment, health care, education First Nations/Aboriginal/Indigenous People
Aspects of Sustainable Mining Correcting legacy sites Over 1,000 derelict sites in Canada Who is responsible? Can we prioritize this work? Future mine closure plans Develop walk-away solutions? Restore the site or change its use? Practice perpetual monitoring & treatment? Dealing with Artisanal Mining Site Remediation (environmental and social) Training in new processing methods
What is Sustainability? - like maybe 600 or more • a number of definitions exist • The Bruntland Commission's definition "to meet the needs of the present without compromising the ability of future generations to meet their needs." Note: temporal, political, social, and spatial components are part of this definition
Components of Sustainable Mining Politics Social Environment Society Physical Environment Economics Technology
Contexts of Sustainability Politics Social Environment Society Exploitation Physical Environment Economics Technology
Contexts of Sustainable Mining Government and Regulations Politics Social Environment Society Physical Environment Economics Technology
Contexts of Sustainable Mining Politics Social Environment Society Investing for The Future Physical Environment Economics Technology
Contexts of Sustainable Mining Politics Cultural Values Social Environment Society Physical Environment Economics Technology
Contexts of Sustainable Mining Politics Social Environment Society Working with Communities Physical Environment Economics Technology
Contexts of Sustainable Mining Sharing the Wealth Politics Social Environment Society Physical Environment Economics Technology
Contexts of Sustainable Mining Government and Regulations Sharing the Wealth Politics Cultural Values Social Environment Society Investing for The Future Working with Communities Exploitation Physical Environment Economics Technology
Contexts of Sustainable Mining • Exploitation • Government and Regulation • Investing for the Future • Cultural Values • Working with Communities • Sharing the Wealth Are these contexts always in conflict? If so, what generates such depth of conflict?
Contexts of Sustainable Mining The "debate" is between • The "Common Good" and the Individual • Scientific Belief and Faith-based Reasoning • The Strong and the Weak • The Rich and the Poor ("Occupy the mine?") • Producers and Consumers
Causes of the Conflict Conflict arises because of UNCERTAINTY Earth’s resources Financial resources Availability of extracted values Mining impacts on the environment Social environment of the mine Impact on social and cultural values Resources/people to achieve goals
A New Definition Sustainable Mining is "evaluation and management of the uncertainties and risks associated with earth resource development." 2014 SUSTAINABLE INDUSTRIAL PROCESSING SUMMIT AND EXHIBITIONSHECHTMAN INTERNATIONAL SYMPOSIUM
The Evolution of Sustainable Mining • 1970 – The Environmental Movement • 1988– The Bruntland Commission • 1995– Protecting the Environment accepted • 2013 – Sustainability became mature • But what's next? • Saving the planet (Kyoto Protocol - 1997) • Peace in our time (Iraqi-US War - 2003) • Sharing the wealth (Global Warming - 2007) • Living forever (Nanotechnology - 2012) • Post-humanism (The Machine Age – 2017)
Life Expectancy at Birth - Canada Source: Statistics Canada 2014 SUSTAINABLE INDUSTRIAL PROCESSING SUMMIT AND EXHIBITIONSHECHTMAN INTERNATIONAL SYMPOSIUM
World Population Trend by Decade Year World population 10-yr growth (mid-year) rate (%) __________________________________________________________________________ 1950 2.56 18.9 1960 3.04 22.0 1970 3.71 20.2 1980 4.45 18.5 1990 5.28 15.2 2000 6.08 12.6 20101 6.85 10.7 20201 7.58 8.7 20301 8.25 7.3 20401 8.85 5.6 20501 9.35 4.1 • 1 Estimated - Source: U.S. Census Bureau, International Database.
World Population Trend Factors • Fertility rates • Rates in Third World 2-3 times Developed World • Mortality rates • Need for health care and basic infrastructure • Epidemics – HIV / AIDS • Poverty rates • When poverty declines, fertility rates decline • When poverty declines, mortality rates decline • Life expectancy • Major breakthrough expected to defeat "old age" via the SENS Project
UN Millennium Development Goals/Targets • Eradicate extreme poverty and hunger • - 50% reduction from 1990 levels by 2015 of people living on < $1.25/day • - 100% productive employment for all • Achieve universal primary education • - Ensure all children by 2015 are able to complete primary schooling • Promote gender equality and empower women • - Eliminate gender disparity in schooling
UN Millennium Development Goals/Targets • Reduce child mortality • - Lower under-5 mortality rate by 67% between 1990 and 2015 • Improve maternal health • - Reduce maternal mortality ratio by 75% between 1990 and 2015 • Combat HIV/AIDS, malaria and other diseases • - Halt spread of HIV/AIDS & start reversal by 2015
UN Millennium Development Goals/Targets • Ensure environmental sustainability • - Integrate sustainable development into policies • - Reduce biodiversity losses significantly by 2010 • - Access to drinking water and basic sanitation - 50% increase by 2010 • - Improve lives of >100 M slum dwellers by 2020 • Develop global partnerships for development • - Open, non-discriminatory, rule-based, & predictable trading/financial system • - Meet special needs of least-developed countries • - Long-term sustainable debt for developing countries • - Provide access to affordable, essential drugs • Make new IT and communication systems available
UN Millennium Development Progress by 2009 • Human development indicators are up • Extreme poverty is falling rapidly • Global poverty down by 40% since 1990 • Number of people earning <$1.25 per day declined by ~500 M from 1991 to 2005 • From 42% to 25% of developed world population • East Asia reached extreme poverty goal by 2005 • Poverty in sub-Saharan Africa is also falling rapidly
UN Millennium Development Progress by 2009 • Children not in school: 115 M (2002) >> 101 M (2007) • Primary school completion rate (2007) • 86% - all developing countries • 93% for middle-income countries, and • 65 % for low-income countries (up from 51% in 1991) • Access to safe drinking water is on track globally • rapid expansion of infrastructure spending • over 1.6 B people gained access to new sources of drinking water – from 76 % (1990) to 86 % (2006)
Poverty – Percent living on <$1.25/day 52% • 48% of the developing world subsist on < $2.00/day 26%
Can we supply the material needs of the Developing World? Problem 1: Declining ore grades Problem 2: Environmental and social issues - Legacy sites - Artisanal miners - Historical views of mining
Top Ten Gold Mines in the World (2012) Name Tonnes Grade Contained Location Owner (Mt) (g/t) Ounces 1. Grasberg 4,909 0.56 88,106,000 Indonesia Freeport-McMoran 2. Lihir 830 2.10 56,000,000 PNG Newcrest 3. Muruntau 625 2.49 50,000,000 Uzbekistan Gov't. Usbekistan 4. Mponeng 122 12.60 49,550,000 South Africa Anglogold Ashanti 5. Olimpiada 459 3.22 47,500,000 Russia Polyus Gold 6. Oyu Tolgoi 3,754 0.38 46,085,000 Mongolia Ivanhoe/Rio Tinto 7. Pueblo Viejo 490 2.38 37,452,000 Dom. Rep. Barrick/Goldcorp 8. Cadia East 2,300 0.45 33,000,000 Australia Newcrest 9. Obuasi 154 5.98 29,520,000 Ghana Anglogold Ashanti 10. South Deep 149 6.16 29,000,000 South Africa Goldfields http://www.nrh.co.il/i/pdf/NRH_Research_2012_World_Gold_Deposits.pdf
World Gold Geological Reserves Gold Deposit Size Number of Deposits Gold Reserves (measured + indicated + inferred) >100,000 oz 4,400 115,000 t Au >10,000 oz 22,000 15,000 t Au FACT: Limited knowledge about small gold deposit reserves Source: Schodde, 2010
Four Possible Solutions • Recycling • Mining small, high-grade deposits - working with artisanal miners • Deep-sea Mining • Mining in Space
Recycling: e-Waste (cell phones) • 7 billion mobile phones (2012) worldwide • 87% of the world population has a cell phone • Asian countries have highest cell/capita (~3) • Cell phone life is about 18 months • A cell phone (100 g) consists of about: • 58% plastic • 25% metals • 16% ceramics • 1% flame retardant Source: Rankin, W.J. 2011. Minerals, Metals and Sustainability. CRC Press, 419p.
Metals in a Cell Phone • Grades are far above today's ores • Problem – diffused locations & low tonnage