Download
1 / 43
440 likes | 480 Views
This chapter provides an overview of cost estimating methods in engineering and management. It covers both "non-analytic" and general estimating methods, including preliminary and detailed estimates, with a focus on decision-making and comparing alternatives. The text explores universal methods such as using opinion and historical data for unit comparison, as well as regression analysis for developing cost relationships. It also delves into performance time data and the PTD algorithm, offering guidance on data collection and analysis. The chapter concludes with discussions on learning curves, project estimating, and the use of probability and statistics in cost estimation.

E N D
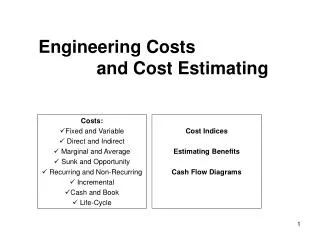
Cost Analysis and Estimatingfor Engineering and Management Chapter 6 Estimating Methods
Overview • Introduction • “Non-Analytic” Estimating Methods • Cost & Time Estimating Relationships • Learning Curves • Proportional Relationships • Using Probability and Statistics
General Estimating Methods • Preliminary Estimates • Limited Information and Time • Compare Alternatives • Decisions (Proceed or Discontinue) • Detailed Estimates • More Quantitative (Solid Information) • Used for Pricing
Other Estimates • Broad Tolerance on Accuracy • ROM • NTE • Effort to Estimate Proportional to Use and Information Available • Estimates Attempt to Forecast Actual Costs
Universal Methods • Opinion • Uses Experience and Judgment • Conference • Collective Opinion • Comparison • Unit
Comparison Method • Bracket Unknown with Known • Known Cost of Similar Product/Project • Find Cost for Upper Bound • Cost for a Lower Bound Is Good, too Eq 6.2
Unit Method • Identify a Cost Driver • Use Historical Data • Find “Cost per…” • Square ft., pound, kW, hp, etc. • Average Cost • Dependent on Quality of Model
Estimating Relationships • Cost (CER) or Time (TER) • Math Models or Graphs • Function of One or More Independent Variables - Causality • CERs are Considered Preliminary • Best if Used Within Data Range
Performance Time Data • Extends Time Study Standards • Standard Time Good Only for Operation(s) Studied • Not Suitable Directly for Estimating • Use Algorithm to Develop Time Study Data into PTD
PTD Algorithm • Collect Data • Classify Data into Common Groups • Use Regression • Separate into Constant and Variable • Set Variable into Equation or Table • Complete, Test, Publish, Implement
Data • Many (12 or so) Studies • Process and Arrange Data • Regression Analysis • Determine Variable Elements
Variable Element Test 1 • Is the Element Variable? • Establish a Limit - P1 (%) • Check at Extremes of Range (x) • Use Computed y Values • “Conditionally” Variable if: ^ Eq 6.4
Variable Element Test 2 • Is the Variability of the Element Significant to the Overall Cost? • Establish Another Limit P2 (%) • Exceeds Both Test 1 & 2 = Variable Eq 6.5
Process the Data • Collect and Add All Constant Elements • Provide Equations or Tables for Each Variable Element • Use Rules for Setting Table Divisions • Include PF&D
Element xmin xave xmax 1 29 65 101 2 8 18 28 3 5 24.5 44 4 3 19.5 36 5 37 71.5 106 Example • Independent Values • P1 = 100% and = P2 10%
Element Regression Equation 1 0.0139 + 0.0027x1 2 - 0.1282 + 0.0216x2 3 0.0642 + 0.0133x3 4 - 0.1156 + 0.0608x4 5 0.1907 + 0.0014x5 Regression Data
Element 1 0.092 0.189 0.287 2 0.045 0.261 0.477 3 0.131 0.390 0.649 4 0.067 1.070 2.073 5 0.243 0.291 0.339 Calculated Values
Element Test 1 Outcome Test 2 Outcome 1 212 Variable 9 Constant 2 960 Variable 12 Constant 3 396 Variable 18 Variable 4 2995 Variable 49 Variable 5 40 Constant Test Results
Elements Normal Time, Min 1 0.189 2 0.261 5 0.291 Total 0.741 STD Min. with PF&D 0.872 Constant Elements
Set Up 1.2 hr Constant 0.87 min Load 3rd Part L + W + H Time (min) 5.0 0.16 9.4 0.22 15.6 0.32 19.7 0.38 No. Spots Time (min) 3 0.08 5 0.22 7 0.36 Estimating Database
Using the TER Database • Select Set-Up Time • Get Constant Unit Time • Determine Value of Independent x • Get Time Value from Equation or Table • If x Is Between Table Values • Use Higher Value
Learning • Repetition Improves Performance • Design Improvements • Process Improvements • Operator Efficiency Improvement • Improvement Is Predictable • Improvement Generally Decreases Exponentially
Element 1 0.092 0.189 0.287 2 0.045 0.261 0.477 3 0.131 0.390 0.649 4 0.067 1.070 2.073 5 0.243 0.291 0.339 The Learning Theory • Time/Cost Decreases by a Constant % • Each Time the Quantity Doubles • Finding the “Slope” Eq 6.6 Eq 6.7 Eq 6.8 Eq 6.9
Expanding • Cumulative Time for N units • Average Time per Unit for N units Eq 6.10 Eq 6.12 Eq 6.11
More Learning Curve Notes • Eq 6.12 Works for N > 20 • Finding s from Known Times • Limitations • Not for Small Items or High Production Jobs Eq 6.13
Project Estimating • Power Law and Sizing • Economies of Scale • Correlating Exponent m Eq 6.14 Eq 6.15 Eq 6.16
Other CERs • Caution, Keep Scale within Factor of 5 • Variable and Fixed Components • Multi-Variable Eq 6.17 Eq 6.18 Eq 6.19
Factor Method • Mostly for Major Projects • Summary Model • Uses Separate Factors • Includes Cost Index Eq 6.20 Eq 6.21
Using Probability and Statistics • Expected Value • Range • Percentile • Monte Carlo Simulation
Expected Value • Elements of Uncertainty Assigned Probabilities • Certain Events (NO Other Possibilities) • Mutually Exclusive Events • Probabilities Indicate the Future • Expected Value Eq 6.22
Range • Most Likely Value • Optimistic and Pessimistic Estimates • Expected Cost and Variance Eq 6.23 Eq 6.24
More on Range • Central Limit Theorem • Mean of the Sum = Sum of Means • Variance = Sum of Variances • Probability Actual Cost Will Exceed Upper Limit Eq 6.27
Percentile • Three Costs • Best Case 10% (1 in 10 Cost Is Lower) • Best Value 50% • Worst Case 90% (1 in 10 Cost Is Higher) • Find the 3 Estimates • Express (10% and 90%) as Differences from 50%
Item Percentile Difference 10th 50th 90th (50 – 10) (90 – 50) 1 $25 $33 $44 $8 $11 2 9 13 15 4 2 3 3 4 7 1 3 Example
(50 – 10)2 Midvalue (90 – 50)2 $64 $33 $121 16 13 4 1 4 9 Total 81 50 134 Square root $9 $11.58 Square and Sum • Square Root of Sum = Contribution to Uncertainty
Final Result • 50th Percentile = $50 • 10th Percentile 50 - 9 = $41 • 90th Percentile 50 + 11.58 = $61.58
Monte Carlo Simulation • Mathematical Models • Repeatedly Run Using Random Input for Variables • Based on Expected Probabilities • Many Runs (1000s) Gives Cost Distribution
Single Value vs Distribution • Compare A and B • Single Values - Choice is Obvious • Distribution - Choices May Overlap
Summary • How to Use Non-Analytic Methods • About CERs and TERs • Effects of Learning on Estimating • Various Ways of Using Proportionality • Impact and Uses of Probability and Statistics for Estimates