Download
1 / 44
440 likes | 463 Views
Learn about thermals, their formation, and soaring techniques in this comprehensive guide. Discover how to forecast thermal strength, utilize models, and access essential weather data for successful soaring adventures.

E N D
Thermal Soaring Forecasting Michael F. Stringfellow
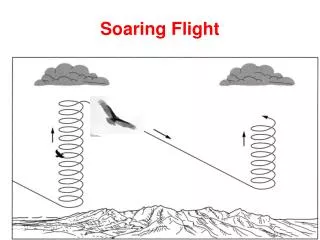
Introduction • Thermals • Columns or bubbles of warm air that rise from the ground when it is heated by the sun • Soaring • Sustained engineless flight using natural sources of lift
Definitions • Boundary or mixing layer • The lower zone of the atmosphere near the ground where thermals occur • Lapse rate • Fall of temperature with altitude • Dew point • Temperature at which moisture vapor in the air condenses • Skew-T Chart • Diagram used by meteorologists to plot lapse rate and relative humidity
Making Thermals • Conditions required to produce thermals: • Solar heating of ground • Requires fairly cloudless skies • Mostly dry soil • Pooling of air warmed by ground contact • Light winds or sheltered areas • Thermal triggers • Natural or man-made disturbance • Buoyancy • Air above warm air at ground level is lighter • Cooler or drier
Thermal Behavior • When triggered, hot air rises • If surrounding air is lighter, thermal continues rising • Thermal stops rising when it reaches temperature of surroundings by: • Rising and cooling • Mixing and entrainment of surrounding air • Thermal strength depends on difference in temperature between it and surrounding air • Thermal Index
Thermal Structure • A thermal is normally thought of simply as a single-core rising column of warm air • However, other structures are more likely, including: • Rising bubble • Rising ring vortex • Linked plumes • Multiple cores • Real-world thermals are likely a mixture of these
General Characteristics of Thermals • Fastest rising air at center or core of thermal • Slower rising air further from the thermal center • A mixing layer around the thermal • Sinking air beyond this
Cumulus formation • Cloud forms when rising air cools to local dew point • Fair-weather cumulus clouds are good indicators of thermal activity • Note that clouds persist after initiating thermal has died • Larger clouds may generate their own circulation
Thermal Forecasting • Estimate solar heating of ground • Sun angle (time of year/day) • Cloud cover • Moisture content of soil • Excess must be evaporated before soil heats • Estimate lapse rate and dew point of air • Actual and forecast soundings
Predicting Thermal Strength • Compare thermal parcel temperature with that of surrounding air at various heights • Thermals cool at a known rate with height • Dry adiabatic lapse rate = 5.5 deg F per 1,000 feet • Saturated adiabatic lapse rate = 2.7 deg F per 1,000 feet • Energy is released as water vapor condenses • Note that moist air is more buoyant than dry air • A little moisture drawn into dry air can enhance the thermal
Actual Soundings • Usually from balloons carrying a radiosonde • In Arizona done daily from Tucson and Flagstaff • Useful to get an idea of air mass • BUT 6:00 AM sounding is too early for reliable afternoon soaring forecast • Ground-based sensors under development • Most data from satellites • Using sensors at many wavelengths from infrared through visible • Water vapor has strong infrared emission • Calculate atmosphere temperature and moisture profile
Forecasts using computer models • Mathematical models of the atmosphere are used to predict conditions in the future, from: • Known atmospheric conditions • Actual soundings • Weather station reports • Satellite data • Basis for weather forecasts, Dr. Jack’s Blipmaps and newer soaring forecast online tools • Significant advances in past decade • Computer power enables faster simulations with higher spatial resolution
Models you will come across • GFS (Global Forecast System) – worldwide • Predicts out to about a week • NAM (North American Model) – North America • Predicts out two to three days • Nam 3 has 3 km resolution • RAP (RAPid update cycle) – North America • Predicts about one day • HRRR (High Resolution Rapid Refresh) • …and others
Predictions from Models • Lapse rate and dew point • Top of the lift • Buoyancy/shear ratio • Winds • Convergence/Divergence (lines of lift and sink) • Convective potential energy • Precipitable water • ….and other good stuff
Ways to access model data • National Centers for Environmental Prediction (Division of NWS) http://www.ncep.noaa.gov/ • NOAA Forecast Research Branch (FRB) • Interactive Skew-T • https://rucsoundings.noaa.gov/
Top of the lift • Generally calculated as the height of the predicted -3 thermal index • Top of thermal sometimes better predictor in Arizona • These numbers are for average thermals • Hotter thermals could rise faster and further • Thermal variability • How high will hotter thermal go? • Depends on shape of lapse rate curve
Buoyancy /shear ratio • Strong winds result in turbulence that tends to break up thermals • Buoyancy/shear is a ratio of the potential thermal strength to the wind shear that causes turbulent break up • Ratio below ~ 5 means broken thermals • Strong thermals may be workable
Programs for Soaring Pilots • Dr. Jack’s Blipmaps • First real soaring forecast program • Not fully supported since 2010, but still available • RASP • Locally run derivative of Dr. Jack’s Blipmaps • XC Skies • Modern program developed by paraglider pilots based in Salt Lake City, updated 2017 • SkySight – developed by Australian glider pilot • TopMeteo – linked to SeeYou • Southwest Soaring Forecast website links
XC Skies features • Advantages: • Uses advanced dynamic mapping techniques • Dr. Jack used fixed maps • Forecasts based on six major computer models • GFS lower resolution, but long-term • NAM 3 and HRR 3 high resolution, but short-term • Enables point and route soaring forecasts • Disadvantages: • Does not specifically map convergence, wind shear or vertical velocity
SkySight Features • Similar to XC Skies in presentation of data • Advantages: • Good visualization of parameters • Includes several pages on convergence, wind shear and vertical velocity • Good Skew-T plotting • Cross-section for a point • Easy route planning • Disadvantages: • Only uses one low-resolution computer model
Arizona RASP • Regional Atmospheric Soaring Prediction • Derived from Dr. Jack’s BLIPMAPS • Boundary Layer Information Prediction maps • Forecasts run daily in early morning • Dave Leonard operates server in Colorado • Best free program for Arizona soaring forecast visualization
Soaring in the southwest • Hazards from thunderstorm development • Lightning • Only a major hazard in rain shaft of active storm • Downbursts • Flow down in rain shaft and then outwards • Gust fronts • Organized and long – duration outflow winds from line of storms • May travel tens of miles from storm and persist for hours
Access Models Directly • HRRR in particular has useful data • https://rapidrefresh.noaa.gov/hrrr/ • Winds – including gust fronts • Very useful in desert southwest where these are a serious problem • Forecast convection • Echotop height gives good indication of shower activity • Vertical velocity • Indicates convergence and wave conditions
Other things to remember • Check water vapor satellite image • Cross-check all available models for consistency • Use real-world sanity checks • Cloud cover • Temperature • Webcams
Final remarks • Successful soaring forecast requires • Understanding of underlying principles • Access to current forecast computer models • Interpretation of data • Bit of luck