Download
1 / 20
200 likes | 223 Views
CS 420 / 620 HCI. Activity Diagrams. [Arlow and Neustadt, 2005]. University of Nevada, Reno Department of Computer Science & Engineering. Outline. Activity diagrams Introduction Activities Nodes Action nodes Control nodes Object nodes Activity parameters.

E N D
CS 420 / 620 HCI Activity Diagrams [Arlow and Neustadt, 2005] University of Nevada, Reno Department of Computer Science & Engineering
Outline • Activity diagrams • Introduction • Activities • Nodes • Action nodes • Control nodes • Object nodes • Activity parameters Activity diagrams
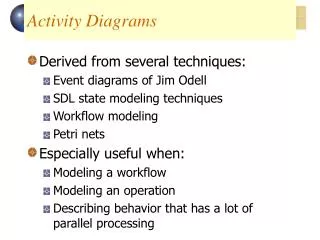
Introduction: What are activity diagrams? • Activity diagrams: • A form of “object-oriented flowcharts” • In UML 1 they were special cases of state machines; in UML 2 they have new semantics, based on Petri Nets • Greater flexibility to model different types of flow • Clear distinction between activity diagrams and state machines • Attached to modeling elements to describe behavior • Typically attached to use cases, classes, components, interfaces, and operations • Can also be used to model business processes and workflows Activity diagrams
Introduction: Where are activity diagrams used? • Commonly used in: • Analysis • To model the flow of a use case • To model the flow between use cases • Design • To model details of an operation • To model details of an algorithm • Business modeling • To model a business process • As always in modeling, it is important to keep them simple and understandable by their intended audience Activity diagrams
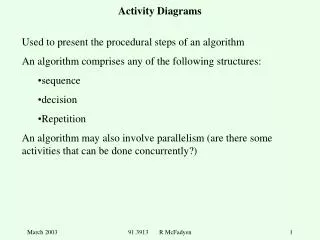
Activities • Activity diagrams = networks of nodesconnected by edges • Nodes • Action nodes – atomic units of work within the activity • Control nodes – control the flow through the activity • Object nodes – represent objects used in the activity • Edges • Control flows – depict the flow of control through activity • Object flows – depict the flow of objects through activity Activity diagrams
Activities • Activities and actions can have pre- and post-conditions • Tokens (part of semantics but not shown graphically) abstractly flow in the network and can represent: • The flow of control • An object • Some data • A token moves from a source node to a target node across an edge depending on: • Source node post-conditions • Edge guard conditions • Target node preconditions Activity diagrams
Activities • Example of an activity (“send letter”), Fig. 14.2 [Arlow & Neustadt 2005] Activity diagrams
Activities • Activity diagrams have semantics based on Petri Nets • They model behavior using the token game • Tokens move through the network subject to conditions • Object nodes represent objects flowing around the system • Example of flow of control token, Fig. 14.5 [Arlow & Neustadt 2005] Activity diagrams
Activities • Activity diagrams can be divided in partitions (swimlanes) using vertical, horizontal, or curved lines. Example, Fig. 14.6 [Arlow & Neustadt 2005] Activity diagrams
Action nodes • Action nodes execute when: • There are tokens present at all their input nodes AND • The input tokens satisfy all action node’s local preconditions • Fig. 14.9 [Arlow & Neustadt 2005] Activity diagrams
Action nodes • Types of action nodes, Table. 14.1 [Arlow & Neustadt 2005] Activity diagrams
Action nodes • A call action node invokes an activity, behavior, or operation, Fig. 14.11 [Arlow & Neustadt 2005] Activity diagrams
Action nodes • An accept time event action node responds to time, Fig. 14.12 and Fig. 14.13 [Arlow & Neustadt 2005] Activity diagrams
Control nodes • Control nodes manage the flow of control within an activity • Table 14.2 [Arlow & Neustadt 2005] shows the types of control nodes Activity diagrams
Control nodes • Examples of decision and merge nodes, Fig. 14.14 and Fig 14.15 [Arlow & Neustadt 2005] Activity diagrams
Control nodes • Examples of join and fork nodes, Fig. 14.17 [Arlow & Neustadt 2005] Activity diagrams
Object nodes • Object nodes indicate that instances of a particular classifier are available at a specific point in the activity • The input and output edges are object flows • Object flows are special types of flow that describe movement of objects within the activity • The objects are created and consumed by action nodes • When an object node receives an object token on one of its input edges, it offers this token to all its output edges, which compete for the token. Activity diagrams
Object nodes • Object node notation and their buffer semantics: Figs. 14. 18, 14.20 and 14.21 [Arlow & Neustadt 2005]. Object nodes act as buffers – places in the activity diagram where object tokens can reside while waiting to be accepted by other nodes (via edges). Activity diagrams
Object nodes • Examples of using object nodes: Figs. 14. 19 and 14.22 [Arlow & Neustadt 2005]. Note that object nodes can represent objects in particular states. Activity diagrams
Activity parameters • Activities can have object nodes to provide inputs and outputs, Fig. 14. 23 [Arlow & Neustadt 2005]. Activity diagrams