Download
1 / 21
220 likes | 362 Views
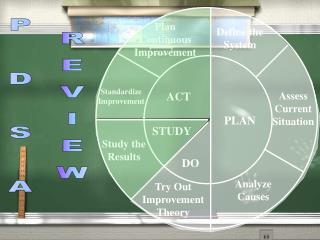
Plan Continuous Improvement. Define the System. Standardize Improvement. ACT. Assess Current Situation. PLAN. STUDY. Study the Results. DO. Analyze Causes. Try Out Improvement Theory. P D S A REVIEW. Define the System. Pgs 66-90. Purpose:

E N D
Plan Continuous Improvement Define the System Standardize Improvement ACT Assess Current Situation PLAN STUDY Study the Results DO Analyze Causes Try Out Improvement Theory P D S A REVIEW
Define the System Pgs 66-90 • Purpose: • Describe the characteristics of the system to be studied • Prepare for gathering data • Purpose is always to meet the students’ need • Outcome: • Complete Description of the system • Project Statement/Goal • Data Gathering Plan
Define the System Questions • What is the problem? Why are we selecting it? • What is the current way this process is done? • What are the key measures for these processes? • What is important about this process? • The purpose of this strategy is to improve __________ as measured by ____________.
Possible Tools • Flow Chart (Picture of the current process) • Process Diagram • Measures (To determine current level of performance and gauge • future improvements) • Data Gathering Plan • Check Sheet • Run chart
Assess the Current Situation • Purpose: • Have current and ongoing knowledge of the system’s performance • Understand the patterns and trends in baseline data • Outcome: • Analysis of baseline data • Identification of special causes of variation Pgs 92-100
Assess the Current Situation Questions • How big of a problem is it? • What data do I have that shows the current level of performance (baseline data) of the area I’m trying to improve? • What does the data tell us? • New insights from the data?
Assess the Current Situation Why Collect Data? • Gain a better understanding • Track progress • Analyze gaps • Set, monitor and evaluate goals • Make decisions based on fact
Possible Tools- Assess the Situation • Affinity Diagram • Cause & Effect – Fishbone • Pareto Diagram • (Identify key culprits of the problem) • Charts using data collected from data gathering plan: control chart, bar chart, histogram, run chart
Analyze Causes Pgs 102-106 Purpose: • Identify & verify possible common causes of variation in the system being studied • Generate improvement theory Outcome: • Improvement theory If we… Then we….. As measured by….
Analyze Causes Questions • What are the root causes that are producing the results I’m getting- as evident in the baseline data?
Analyze Causes Possible Tools • Cause and Effect Diagram (Focusing on Key Culprits) • Fishbone Diagram • Relations Diagram • Pareto Diagram
Improvement Theory Purpose: • Test the Improvement Theory Outcome: • A test of the research-based theory • New data collected after the theory has been tried
Improvement Theory If we do this …(improvement theory based on root causes) Then we…(expected results) As measured by…(data gathering plan- results will be compared to baseline data collected in “Define the System”) D O
Questions Improvement Theory • How will I test the theory? • What will I do differently? • What actions will be carried out? • Based on the root causes, what can I do differently to produce more positive results? D O
Try Out the Improvement Theory Tools • Force Field Analysis(To anticipate road blocks or barriers of the proposed change) • Action Plan(Road Map to carrying out plan) • Run Chart, Scatter, Bar Chart (to collect data)
Study the Results Purpose: • Check to see if the Improvement Theory worked Outcome: • A data-based decision to act on (standardize) or abandon the actions taken to improve the system. • An explanation of why the results turned out the way they did (positive or negative)
Study the Results Questions S T U D Y • Did my improvement theory work? • Was the theory effective in raising performance? • How does this new data compare to the baseline data? • What data do I have that shows the new level of performance?
Study the Results Tools: • Tools to compare the data collected (after the improvement theory was implemented) to baseline data • Charts to display the results • Implementation notes • If results were favorable, discuss how to standardize S T U D Y
Standardize Improvements • If the results were favorable in “Study the Results” it is time to standardize • Create a new flow chart that represents the new way the system should operate • Communicate changes in the system to all stakeholders A C T
Plan Continuous Improvement • Display the PDSA story board that shows how the system was improved • Ensure all stakeholders understand the new way the system is to operate • Create a data gathering plan to ensure that the system continuous to work effectively • Look for another aspect of the same system to improve (look back to the Pareto Diagram to select the next “culprit” A C T
An Organizer and Integrator Results Triad Leadership Triad Faculty & Staff Plan Results/Goal Leadership Student Needs Processes Measures/Data Analysis/Knowledge Management Susan Leddick