Download
1 / 34
350 likes | 797 Views
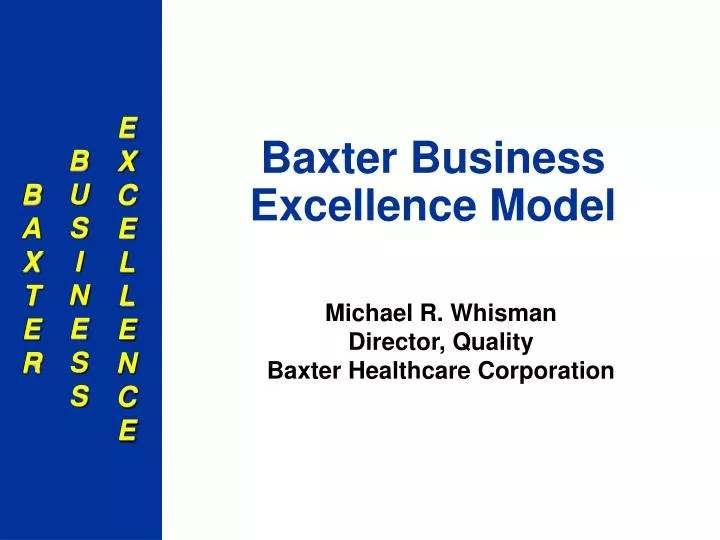
Baxter Business Excellence Model. Michael R. Whisman Director, Quality Baxter Healthcare Corporation. Ex-Army Captain (Viet Nam Era) Over 33 Years – Healthcare Industry (Manufacturing & QA) 20 Years at Baxter Baldrige Examiner (1997 – 2009) Shingo Examiner (2005 – 2009)

E N D
Baxter Business Excellence Model Michael R. Whisman Director, Quality Baxter Healthcare Corporation
Ex-Army Captain (Viet Nam Era) Over 33 Years – Healthcare Industry (Manufacturing & QA) 20 Years at Baxter Baldrige Examiner (1997 – 2009) Shingo Examiner (2005 – 2009) ASQ ITEA Judge (2002 – 2009) Chairman, ASQ Team & Workplace Excellence Forum (2008 – 2009) BS – Management (Texas A&M) MBA – Pepperdine Univ. 6-Sigma Black Belt Baxter Master Black Belt 40 Years - Married – 2 Grown Kids, 1 New Grandson & Puppy Michael (Mike) R. Whisman
Questions • How many are implementing models? • What kind of issues do you face? • How many believe you have to have support from the top to successfully implement? Let’s take a look at the model we use at Baxter
MODEL - OVERVIEW Baxter Business Excellence Model
Baxter Business Excellence Model Complete View Strategic Challenges A L I G N I N T E G R A T E Strategic Objectives Value Streams & Key Metrics A S SE S S Improvement Opportunity Identification and Prioritization Lean Six Sigma DFSS / DMAIC Methodology Tool Set Total Employee Involvement Tangible, Verifiable Results
Baxter Business Excellence Model With Pictures Strategic Challenges Strategic Objectives Value Streams & Key Metrics Improvement Opportunity Identification and Prioritization Lean Six Sigma DFSS / DMAIC Methodology 6s * Kaizen ** Lean *** Total Employee Involvement Tangible, Verifiable Results Provides focus, ensures alignment of all employees towards common goals, time-tables and targets. TOOLS * Six Sigma – Variation ** Kaizen – Quick Change *** Lean – Waste
Strategic Challenges and Objectives External Strategic Challenges Internal Strategic Challenges Strategic Challenges Operational Organizational Competitor/Market Supplier Business Customer 1. 2. 3. 4. 5. 6. 7. 8. 9. 10. Key Strategic Challenges Key Strategic Objectives Strategic Objectives 1. 2. 3. 4. 5. Note: Strategic Objectives can cover multiple Strategic Challenges
Strategic Challenges Strategic Objectives Value Streams & Key Metrics Improvement Opportunity Identification and Prioritization Lean Six Sigma DFSS / DMAIC Methodology 6s Kaizen Lean Total Employee Involvement Tangible, Verifiable Results Baxter Business Excellence Model Map processes that support key strategic objectives and create customer value. Include baseline on key measures and targets for improvement; lead time, cost, quality, yield, etc.
Value Streams and Key Metrics External Strategic Challenges Internal Strategic Challenges Strategic Challenges Business Customer Operational Organizational Competitor/Market Supplier 1. 2. 3. 4. 5. 6. 7. 8. 9. 10. Key Strategic Challenges Key Strategic Objectives Key Metrics: 1, 2 1 1, 2 Targets: A, B A A, B
Value Streams and Key Metrics Move from departmental thinking… Sales & Marketing Manufacturing Environment, Health, &Safety Finance Product Development Information Technology Human Resources Quality & Regulatory Supply Chain
Value Streams and Key Metrics ….To process thinking driven by key metrics with customer and business excellence line-of-sight EH&S Quality & Regulatory Sales & Marketing Customer Supplier Value Creation Product Manufacturing Supply Chain Product Development Human Resources Information Technology Finance
PRODUCTION CONTROL MarketChanges Market Intelligence MRP I I I I Process Step #3 Process Step #1 Process Step #4 Process Step #2 C/T = 10 sec C/O = 1 hr Uptime = 85% Yield = 70% C/T = 30 sec C/O = 1 hr Uptime = 75% Yield = 60% C/T = 30 sec C/O = 2 hr Uptime = 95% Yield = 80% C/T = 20 sec C/O = 2 hr Uptime = 80% Yield = 70% Example Value Stream Map Supplier SalesData Weekly Schedule Distributors WeeklyMaterialShipment 150 units 300 units 50 units 50 units PCT = 151.5 mins Non-Value Add 25 Min. 50 min. 25 min. 50 min Value Add 10 sec. 30 sec 30 sec. 20 sec. VAT = 1.5 mins
Strategic Challenges Strategic Objectives Value Streams & Key Metrics Improvement Opportunity Identification and Prioritization Lean Six Sigma DFSS / DMAIC Methodology 6s Kaizen Lean Total Employee Involvement Tangible, Verifiable Results Opportunity Identification
To engage the organization in process thinking and continuous improvement Value Stream Map: Three Primary Purposes Value Stream 1 Value Stream 2 2. To identify improvement opportunities through process understanding Value Stream 3 3. To manage all improvement efforts toward meeting all key metric targets
Opportunity Identification, Prioritization and Project Selection Value Stream 1 0-6 months future state 12 months future state 24 months future state 36 months ideal state Quick Hit Quick Hit 6-Sigma Project Kaizen Kaizen Kaizen 6-Sigma Project Project 6-Sigma Project 6-Sigma 6-Sigma Kaizen Project Measure Improvements Against Key Metrics and Strategic Objective
Strategic Challenges Strategic Objectives Value Streams & Key Metrics Improvement Opportunity Identification and Prioritization Lean Six Sigma DFSS / DMAIC Methodology 6s Kaizen Lean Total Employee Involvement Tangible, Verifiable Results Baxter Business Excellence Model Mechanism to drive improvement. Standardized methodology and language: Define, Measure, Analyze, Improve, Control. Lean Six Sigma Toolkit.
Value Analysis • Value Added Activities • Activities essential to deliver product or service according to customer requirements. Three criteria: • Transforms the item or service toward completion • Customer cares (would be willing to pay for it) • Done right the first time • Non-Value Added Activities • All other activities. These activities are considered waste.
Baxter’s 11 Wastes • Waste is anything other than the minimum amount of equipment, materials, parts, space, and worker’s time which are absolutely essential to add value to the product. • Shoichiro Toyoda - President, Toyota Definition of Waste • Overproduction • Waiting • Transportation • Excess Motion • Injuries • Inadequate procedures/methods (processing waste) • Unplanned Activities (processing waste) • Inventory • Poor Communication • Defects (not meeting customer requirements) • Variation
Lean Six Sigma Strategic Challenges Strategic Objectives Value Streams & Key Metrics Improvement Opportunity Identification and Prioritization Lean Six Sigma DFSS / DMAIC Methodology 6s Kaizen Lean Total Employee Involvement Tangible, Verifiable Results
What is Lean Six Sigma (LSS)? Lean A focus on waste elimination, standardization, cycle time reduction, smooth process flow etc. Six Sigma A focus on variation reduction that impedes optimized performance. Lean Six Sigma is a robust, data-driven approach to improve and manage key business processes.
...measure what you care about; know your measure is good... IMPROVEMENT CYCLE MANAGE The Methodology: DMAIC ... define the problem, clearly and related to customer... DEFINE MEASURE … look for root causes; generate a prioritized list ANALYZE ... determine and confirm the optimal solution ... IMPROVE …be sure the problem doesn’t come back... CONTROL
The Tools: LSS Toolkit DEFINE MEASURE ANALYZE IMPROVE CONTROL Is/Is Not Diagram SIPOC Process Flow Chart Value Stream Map Kaizen 6S NPV Surveys VOC/CTQ Kano Model Boxplot Dotplot Charts Pareto Chart CTQ Project Y MSA Gage R&R Drilldown Process Capability Study Brainstorm Fishbone FMEA Affinity Multi-Voting Scatter Pareto Chart Fault Tree 5 Whys 6-Sigma Tests Takt Time DOE Mistake-Proofing Standard Work Flexible Workforce Visual Mgt. TPM Level Loading Pull/Kanban Control Plan Operating Procedures Revised Process F low Project Decom-missioning
Strategic Challenges Strategic Objectives Value Streams & Key Metrics Improvement Opportunity Identification and Prioritization Lean Six Sigma DFSS / DMAIC Methodology 6s Kaizen Lean Total Employee Involvement Tangible, Verifiable Results Baxter Business Excellence Model Allocation of the appropriate resources and engagement of the entire organization. Achievement of results directly supporting the organization’s strategic objectives.
Business Excellence Model Align - Integrate - Assess Assess progress toward goals. Refine based upon results and changes to strategic challenges and strategic objectives. Strategic Challenges A L I G N I N T E G R A T E Strategic Objectives Value Streams & Key Metrics A S SE S S Opportunity Identification, Prioritization, and Project Selection Lean Six Sigma DFSS / DMAIC Methodology 6s Kaizen Lean Total Employee Involvement Tangible, Verifiable Results
MODEL - DEPLOYMENT Baxter Efforts 25+ Years
Questions • How many have tried to implement a business model in your company and were successful right out of the gate? • How many have tried to implement a business model and slammed full on into cultural issues: • We’re different • Tried it before and failed • That stuff won’t work here • How many have actually made some inroads with employees, only to see stubborn leaders kill the motivation?
Deployment Resources & Brief History • Initiated QLP in mid-80’s – World-wide Deployment • QLP Sr. VP reporting to CEO – Millions in Funding • 64 Full time Director/Coaches to deploy program • All Leaders sent to Crosby School in Florida • Issues • Deployment to manufacturing world-wide. Division Leaders made an effort. • Merger of Baxter and American Hospital • Did not include Technical Areas (i.e. R&D, IT, Finance, etc.)
Model History • Initiated QLP (Total Quality) in mid-80’s – World-wide Deployment • QLP Sr. VP reporting to CEO – Millions in Funding • 64 Full time Director/Coaches to deploy program • All Leaders sent to Crosby School in Florida • Initiated Baldrige Approach (1989) – Global intent • Deployment to manufacturing world-wide. Some Division Leaders were successful. • Four Full-time VP’s, an award office of staff & 200+ Examiners • Leaders asked “QLP or Baldrige, which one?
Model History • Some Key Plants Initiated Shingo (2000) • Success - Manufacturing Plant Level • Not much interest elsewhere • Merged Shingo with Baldrige Approach (2005 – Present) • Builds on everything we learned thus far • Leaders at Many Levels of the Organization Interested • Lost enough, we are starting over in many areas • Manufacturing Plants – still generally the best examples • Great efforts being made in Quality Organizations
Model History • Lean (2002) • Success in Some Manufacturing Plants • One Key Leader • Business Excellence (2002) • One Sr. VP reporting to Corp. Quality VP • Eleven Person Corporate Group – Five Guru’s with five coaches in training. • Strongest Support in Manufacturing & Quality • IT, Finance, Supply Chain, & a Division are Developing
Pitfalls We Experienced • QLP - Not Training Everyone at Once • Baldrige Model – Placing it in competition with QLP • Seeing LEAN, Six Sigma, Kaizen, etc. as Models • Succession Planning – Failure to consider culture/style • Reduction in Organizational Resources • Decentralization • Program not reporting to the top
What We Did Right • Stuck With IT – Saved Millions, Developed & Maintained a Core Competence in Manufacturing • Merged it all Together • QLP – Culture • Baldrige/Shingo Model – Fits Partial & Complete Organizations • 6-Sigma/Lean/Kaizen/Etc. as Tools • Implementation Anywhere There is Interest • Using Examples of Success to Tempt Leaders • Practicing What We Preach • Baxter is Charging for Success