Download

1 / 20
200 likes | 311 Views
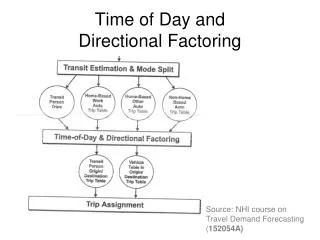
Substrate and Time of Day Effects on Benthic Organisms. Trawling Data. Both Day and Night Data in HeckShare Folder Pool trawl data into per habitat for comparisons between habitats, and between day/night for sand and mud. i.e. Day Trawling – Trawls 2,3 combine for shell

E N D
Trawling Data • Both Day and Night Data in HeckShare Folder • Pool trawl data into per habitat for comparisons between habitats, and between day/night for sand and mud. • i.e. Day Trawling – Trawls 2,3 combine for shell • Compare combined Day Trawls for mud with combined Night Trawls for mud
Similarity Calculations • Compare similarity in fish/invert species composition during day between: • Mud-Sand; Mud-Shell; Sand-Shell (Day and Night) • Use Jaccard similarity index: • J = C / (A+B-C) • A = No. of spp. on substrate 1 • B = No. of spp. On substrate 2 • C = No. of spp. shared by both substrates • Value varies from 0 (no common spp.) to 1 (all common)
Similarity Calculations If Sand has 22 spp. Mud has 20 spp. 10 spp. overlap J = 10 / (22+20-10) J = 0.3125
Euclidean Distance • Considers the distribution of individuals with species in each collection: • DeltaJK = Sqrt [ Sum (Xif – Xik)2 ] • DeltaJK = Euclidean Distance • Xif = Number indiv’s of species “i” in collection “j” • Xij= Number indiv’s of species “i” in collection “k” • n = Total number of species
Euclidean Distance • Compensate for fact that Euclidean Distance increases with number of species in a sample by calculating average distance: • djk = [ Sqrt ( Delta2jk) ] / (n) • djk = average Euclidean distance b/n sample j and k • Deltajk = Euclidean Distance • n = number of species in the samples being compared
Euclidean Dist. Calculations ED1,2 = sqrt [ (2000-1000)2 + (20-10)2 + (0-5)2 ] ED1,3 = sqrt [ (2000-500)2 + (20-5)2 + (0-0)2 ] ED2,3 = sqrt [ (1000-500)2 + (10-5)2 + (5-0)2 ]
Questions Explain why you found the similarity values you did, using material from lecture, notes, text, observations Discuss why Jaccard and Euclidean distances showed different patterns (if they did) Describe similarities and differences in body shape, shell thickness, and general morphology of the taxa inhabiting various substrates
Methods • Every 24 hours, check tethered crabs • Record identity and size of consumed animals • Replace lost animals each day so that original density of 3 animals/tether maintained over next 2 trials • Any escapes or unconfirmed predation, do not count them in analysis. • In raw data, identify any escaped crabs
Data Analysis Compare % of mud crabs, hermits consumed on each of the two habitats using Chi-Square Also evaluate whether crab size or type of a hermit crab’s shell was correlated with percentage of prey taken by predators
Chi-Square • Compares theorized predictions vs. observed data • Ho = no sig diff b/n theorized and exp. populations • Ha = There is a sig diff b/n theorized and exp. Pops • Chi-Square (χ2) = [ Sum (#observed – #expected)2 ] / [ #expected ] • Calculate χ2 value and compare to Table 2 at p=0.05 (on page 55)
Chi-Square Contingency Tables • Take observations (f) and compare to theoretical values (F) calculated from equation: • F = RC/n • Where, F = frequency of observations • R = Row frequency • C = Column frequency • n = Total number of data in all positions of table
Chi-Square Contingency Tables • Obs’d for birds in different regions of forest: • Take Observed data to calculate theoretical: • F for birds in trees in spring = (59*43)/120 • F for birds in shrubs in autumn = (61*42)/120
Chi-Square Contingency Tables Create Theoretical Table to which one may compare observations:
Chi-Square Contingency Tables • Chi-Square Value calculated as: • χ2 = ∑∑ [ (f – F)2 / F ] • Where ∑∑ indicates to sum values across all rows and columns
Chi-Square Contingency Tables χ2 = [(30-21.14)2 / 21.14] + [(20-20.65)2 / 20.65] +[(9-17.21)2 / 17.21] + [(13-21.86)2/21.86] + [(22-21.35)2 / 21.35] + [(26-17.79)2 / 17.79] χ2 = [3.713 + 0.020 + 3.917 + 3.591 + 0.020 + 3.789] = 15.050
Chi-Square Contingency Tables Take value of 15.050 and compare to Critical Value for χ2 at alpha = 0.05 and degrees of freedom DF = (no. of rows – 1) * (no. of columns – 1) DF = (2-1) * (3-1) = 2 So, Critical value at alpha = 0.05 and DF = 2 is 5.991 (pg. 55), which is <15.050 and reject null hypothesis – There is a difference
Questions 1. Are there sig. diff’s in predation rate among habitats? Why do these exist? 2. Does prey size influence the results? 3. Does the kind of shell carried by hermit crabs influence vulnerability to predation? 4. Is predation likely to be an important factor in the ecology of the species studied?