Download
1 / 25
250 likes | 454 Views
Utilizing Performance Data for Livestock Selection. Developed by: Celina Johnson University of Florida. General Definitions. Performance testing - The systematic collection of comparative production information EPD - expected progeny difference

E N D
Utilizing Performance Data for Livestock Selection Developed by: Celina JohnsonUniversity of Florida
General Definitions • Performance testing - The systematic collection of comparative production information • EPD - expected progeny difference • Contemporary group - group of animals that are of same breed, age, sex and have been raised in the same management group. Johnson, 1997
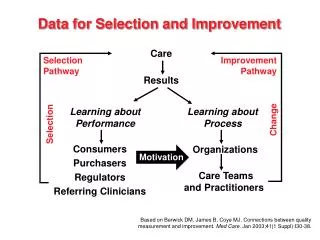
What is Performance Data? • Two General Categories • Animal’s Individual Performance • Genetic Predictors - EPD’s Johnson, 1997
Individual Performance • Adjusted Weights • Adjusted for environmental factors. • Age of animal, age of dam, sex Examples: Adj. 21 day litter weight - swine Adj. Fleece weight - sheep Adj. 205 day weight - cattle Johnson, 1997
Individual Performance • Ratios • The percent above or below the average of the contemporary group. Example: Weaning Wt. 114 vs. 98 Johnson, 1997
Expected Progeny Differences • Not cure all - but most accurate genetic predictor available • Estimates of genetic value that combine pedigree information, individual performance and progeny information into one numerical value. • Can only be used to compare animal’s within a breed or flock (now have across breed EPDs in cattle) Johnson, 1997
Most Common EPDs - Cattle • Birth Weight • measured in pounds • dystocia or calving problems • Weaning Weight • measured in pounds • growth trait • Yearling Weight • measured in pounds • growth trait Johnson, 1997
Most Common EPDs - Cattle • Milk • measured in pounds of calf weaning weight • milk production • Total maternal • calculated by taking half of the weaning and all of the milk EPDs • measure of females productivity Johnson, 1997
Examples Use the same two bulls throughout the cattle examples. EPD: BW WW YW M TM Buford -1.0 +20.0 +30.0 +15.0 +25.0 Cletus +5.0 +35.0 +60.0 + 5.0 +22.5 Johnson, 1997
EPD: BWWWYWMTM Buford -1.0 +20.0 +30.0 +15.0 +25.0 Cletus +5.0 +35.0 +60.0 + 5.0 +22.5 Scenario: Select these bulls for use on first calf heifers with limited labor available. Buford should sire calves that weigh six pounds less on the average, when compared to Cletus. Johnson, 1997
EPD: BWWWYWMTM Buford -1.0 +20.0 +30.0 +15.0 +25.0 Cletus +5.0 +35.0 +60.0 + 5.0 +22.5 Scenario: Select these bulls for producing calves that will be fed in a feedyard through retained ownership. Cletus should sire calves that weigh 30 pounds more on the average, when compared to Buford. Johnson, 1997
EPD: BWWWYWMTM Buford -1.0 +20.0 +30.0 +15.0 +25.0 Cletus +5.0 +35.0 +60.0 + 5.0 +22.5 Scenario: Select these bulls for producing replacement heifers under abundant feed conditions. Buford should sire daughters that wean calves weighing 10 pounds more on the average, when compared to Buford, due to their milking ability. Johnson, 1997
Polled Hereford Bulls The selected bull will be used on a set of mature Angus cows. Limited labor is available during calving. The male offspring will be fed out in a commercial feedyard, heifers kept as replacements. Johnson, 1997
Most Common EPDs - Hogs • 21 day litter weight (LWT) • measured in pounds • similar to weaning weight • Number Born Alive (NBA) • measured in number of piglets • reproductive performance Johnson, 1997
Most Common EPDs - Hogs • Backfat (BF) • measured in inches • leaness and efficiency • Days to 230 (DAYS) • measured in days • growth and efficiency Johnson, 1997
Other Predictors in Swine • Indices • Terminal Sire Index (TSI) • Combines DAYS and BF • Indicates value on a terminal basis • Sow Productivity Index (SPI) • Factors include maternal traits and parity • Generally of the dam of the animal you are evaluating • Maternal Line Index (MLI) • Maternal Sire Index (MSI) Johnson, 1997
Examples Use the same two boars throughout the swine examples. SPI TSI NBA LWT Days BF Hams 115 98 +0.9 +8.4 +1.0 +0.05 Bacon 99 117 -0.5 +2.0 -3.5 -0.08 Johnson, 1997
SPI TSI NBA LWT Days BF Hams 115 98 +0.9 +8.4 +1.0 +0.05 Bacon 99 117 -0.5 +2.0 -3.5 -0.08 Scenario: Select these boars for producing maternally oriented replacement gilts. Hams should produce more maternally oriented gilts due to advantages in SPI, NBA and LWT Johnson, 1997
SPI TSI NBA LWT Days BF Hams 115 98 +0.9 +8.4 +1.0 +0.05 Bacon 99 117 -0.5 +2.0 -3.5 -0.08 Scenario: Select these boars for producing terminal offspring in a farrow to finish operation. Bacon is stronger in the terminal sire categories, TSI, Days and BF. Johnson, 1997
Yorkshire Boars These Yorkshire boars will be mated to elite Yorkshire gilts to produce foundation females. Johnson, 1997
Sheep Performance Data • Actual Performance • Birth/Rearing • S/S - born single, raised single • Tw/S - born twin, raised single • Actual weights • Adjusted for 60, 90, 120 days Johnson, 1997
Sheep Performance Data • Flock EPDs (FEPD) • Can only be applied to an individual flock - not across flocks • Suffolk breed is the only one to have breed wide EPDs • Maternal traits • No. Lambs Born • Units of lamb per lambing • Lbs. Lamb Weaned • Units of pounds of lambs weaned Johnson, 1997
Sheep Performance Data • Growth Traits • 60 day weight • similar to weaning weights • 90 day weight • 120 day weight • similar to yearling weights • Wool Traits • Grease Weight • Pounds of grease fleece weight Johnson, 1997
EPD: Lambs Lbs. 60d 120d Born Wean Wt. Wt. Dumb -0.15 -2.0 -0.15 -0.95 Dumber +0.20 +3.5 +1.00 +1.50 Examples Dumber should producer more pounds of lamb that weigh more through all phases of growth. Johnson, 1997
Dorset Rams Rank these rams as potential stud rams for a purebred Dorset flock. Progeny will be marketed for both purebred and commercial uses. Johnson, 1997