Download
1 / 15

E N D
Graphing of Sine and Cosine Part 2
Sine and cosine functions can be used to model real-world phenomena, such as sound waves. Different sounds create different waves. One way to distinguish sounds is to measure frequency.Frequency is the number of cycles in a given unit of time, so it is the reciprocal of the period of a function. Hertz (Hz) is the standard measure of frequency and represents one cycle per second. For example, the sound wave made by a tuning fork for middle A has a frequency of 440 Hz. This means that the wave repeats 440 times in 1 second.
period amplitude Example 1: Sound Application Use a sine function to graph a sound wave with a period of 0.002 s and an amplitude of 3 cm. Find the frequency in hertz for this sound wave. Use a horizontal scale where one unit represents 0.002 s to complete one full cycle. The maximum and minimum values are given by the amplitude. The frequency of the sound wave is 500 Hz.
period amplitude Example 2 Use a sine function to graph a sound wave with a period of 0.004 s and an amplitude of 3 cm. Find the frequency in hertz for this sound wave. Use a horizontal scale where one unit represents 0.004 s to complete one full cycle. The maximum and minimum values are given by the amplitude. The frequency of the sound wave is 250 Hz.
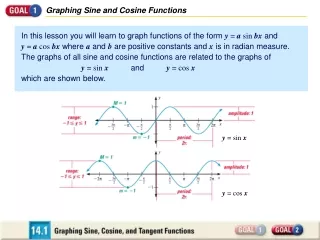
Sine and cosine can also be translated asy= sin(x – h) + k and y =cos(x – h) + k. Recall that a vertical translation by kunits moves the graph up (k > 0) or down (k < 0). A phase shift is a horizontal translation of a periodic function. A phase shift of hunits moves the graph left (h < 0) or right (h > 0).
The period is Example 3: Identifying Phase Shifts for Sine and Cosine Functions Using f(x) = sin x as a guide, graph g(x) = g(x) = sin Identify the x-intercepts and phase shift. Step 1 Identify the amplitude and period. Amplitude is |a| = |1| = 1.
Because h= the phase shift is radians to the right. All x-intercepts, maxima, and minima of f(x) are shifted units to the right. Example 3 Continued Step 2 Identify the phase shift. Identify h.
The first x-intercept occurs at .. The x-intercepts occur at + n, where n is an integer. Example 3 Continued Step 3 Identify the x-intercepts.
The maximum and minimum values occur between the x-intercepts. The maxima occur at + 2n and have a value of 1. The minima occur at + 2n and have a value of –1. Example 3 Continued Step 4 Identify the maximum and minimum values.
sin Example 3 Continued Step 5 Graph using all the information about the function. sin x
Using f(x) = cosx as a guide, graph g(x) = cos(x + ). Identify the x-intercepts and phase shift. The period is Example 4 Step 1 Identify the amplitude and period. Amplitude is |a| = |1| = 1.
Example 4 Continued Step 2 Identify the phase shift. x+ = x – (–) Identify h. Because h = –, the phase shift is radians to the right. All x-intercepts, maxima, and minima of f(x) are shifted units to the right.
The first x-intercept occurs at . Because sin x has two x-intercepts in each period of 2, the x-intercepts occur at + n, where n is an integer. Example 4 Continued Step 3 Identify the x-intercepts.
Example 4 Continued Step 4 Identify the maximum and minimum values. The maximum and minimum values occur between the x-intercepts. The maxima occur at + 2n and have a value of 1. The minima occur at 2n and have a value of –1.
Example 4 Continued Step 5 Graph using all the information about the function. y cos x x – cos (x+)