
Uploaded by
gay
5 SLIDES
262 VIEWS
60LIKES
IBIC corrections
DESCRIPTION
IBIC corrections. There were several things “wrong” with IBIC data analysis Fourier power plotted rather than amplitude Frequency index 10 kHz too high Transients WERE included, they should not have been Next few slides shows what happens if these things are corrected. Original IBIC.
Download
1 / 5
Download Presentation 
IBIC corrections
An Image/Link below is provided (as is) to download presentation
Download Policy: Content on the Website is provided to you AS IS for your information and personal use and may not be sold / licensed / shared on other websites without getting consent from its author.
Content is provided to you AS IS for your information and personal use only.
Download presentation by click this link.
While downloading, if for some reason you are not able to download a presentation, the publisher may have deleted the file from their server.
During download, if you can't get a presentation, the file might be deleted by the publisher.
E N D
Presentation Transcript
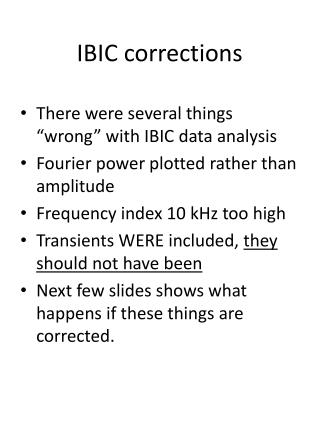
IBIC corrections • There were several things “wrong” with IBIC data analysis • Fourier power plotted rather than amplitude • Frequency index 10 kHz too high • Transients WERE included, they should not have been • Next few slides shows what happens if these things are corrected.
Original IBIC Plot exactly as in IBIC 2012 paper Transients NOT removed POWER plotted Frequency incorrectly indexed


More Related