Download
1 / 28
280 likes | 385 Views
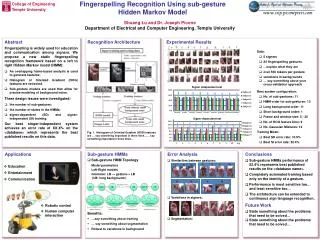
Experimental Results on the Classification of UTE and McFlash Sequences. Giovanni Motta Jan 21, 2005. Unupervised Classification. Voxels are divided into 16 classes with a K-means algorithm A class is assigned to each voxel, similar voxels belong to the same class

E N D
Experimental Results on the Classification of UTE and McFlash Sequences Giovanni Motta Jan 21, 2005
Unupervised Classification • Voxels are divided into 16 classes with a K-means algorithm • A class is assigned to each voxel, similar voxels belong to the same class • Classification is visualized with maps where different colors represent different classes • At the present, color assignment is random; some color assignments look “better” (more contrasted) then other. Evaluating the results may be hard because of this
Unupervised Classification • The classifier is trained on a ROI that is manually selected for each image • The ROI excludes the background • Results are reported for classification of: • Original voxel vectors V(i,j) • Mean removed voxels V(i,j)- mean(V(i,j)) • Unitary voxels V(i,j)/|V(i,j)| • Mean removed, unitary voxels (V(i,j)- mean(V(i,j))) / | V(i,j)- mean(V(i,j)) |
Sequences • UTE • Fat saturation • 4 echoes • 20 sequences 256x256 (4) or 320x320 (16) • TE = 0.08, 3.25, 6.42 and 9.59ms (2) • TE = 0.08, 4.53, 8.98 and 13.5ms (11) • TE = 0.08, 5.81, 11.6 and 17.4ms (4) • TE = 0.08, 6.90, 13.8 and 19.6ms (3)
UTE_0001 Original Mean Removed Unitary Mean + Unitary
UTE_0002 Original Mean Removed Unitary Mean + Unitary
UTE_0003 Original Mean Removed Unitary Mean + Unitary
UTE_0004 Original Mean Removed Unitary Mean + Unitary
UTE_0005 Original Mean Removed Unitary Mean + Unitary
UTE_0006 Original Mean Removed Unitary Mean + Unitary
UTE_0007 Original Mean Removed Unitary Mean + Unitary
UTE_0008 Original Mean Removed Unitary Mean + Unitary
UTE_0009 Original Mean Removed Unitary Mean + Unitary
UTE_0010 Original Mean Removed Unitary Mean + Unitary
UTE_0011 Original Mean Removed Unitary Mean + Unitary
UTE_0012 Original Mean Removed Unitary Mean + Unitary
UTE_0013 Original Mean Removed Unitary Mean + Unitary
UTE_0014 Original Mean Removed Unitary Mean + Unitary
UTE_0015 Original Mean Removed Unitary Mean + Unitary
UTE_0016 Original Mean Removed Unitary Mean + Unitary
UTE_0017 Original Mean Removed Unitary Mean + Unitary
UTE_0018 Original Mean Removed Unitary Mean + Unitary
UTE_0019 Original Mean Removed Unitary Mean + Unitary
UTE_0020 Original Mean Removed Unitary Mean + Unitary
Sequences • McFlash • Non fat saturated • 9 echoes • Classification on the original voxels and on the voxels after Mark’s SVD denoising
McFlash (Noisy) Original Mean Removed Unitary Mean + Unitary
McFlash (SVD Denoised) Original Mean Removed Unitary Mean + Unitary
To Do • Find a criterion to assign a unique colormap so that results can be easily compared • Compare with classification based on parametric representation (Ma, Mb, etc..) • Train on specific ROI (fibrosis, HCC, normal liver)