Download
1 / 29
290 likes | 397 Views
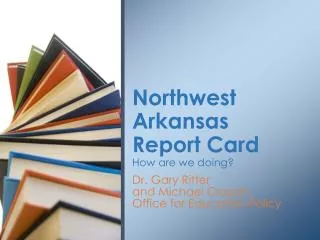
Arkansas Report Card. A seven year look into State Performance. Office for Education Policy. Mission Statement. The Office for Education Policy Started in 2003. We have published 6 State Report Cards over the Years.

E N D
Arkansas Report Card A seven year look into State Performance Office for Education Policy
Mission Statement • The Office for Education Policy Started in 2003. • We have published 6 State Report Cards over the Years. • The Office for Education Policy (OEP) conducts and gathers relevant education research and provides data and policy analysis aimed at improving PK-12 education policy and practice in Arkansas.
AR Education Reports • Policy Briefs • Report Cards • Newsletters • Data Resources www.officeforeducationpolicy.org/
Topics in 2013 State Report Card • State Profile • Benchmark Exam • Iowa Test of Basic Skills (ITBS) Exam • NAEP Math Performance • NAEP Reading Performance • End-of-Course (EOC) Exam • Spotlight: Arkansas Teacher Corps • Graduation Rates • Spotlight: Schools of Innovation • Student Enrollment • Arkansas K-12 School Finance • Pre-School in Arkansas • Spotlight: EAST and New Tech
Arkansas at a glance Change in Demographics over the years Measurement of Student Performance Achievement of Important Student Sub groups Graduation Rates School Finance Table of Contents
Arkansas at a glance over the last 20 years The arrow highlights the year 2004-2005 where district consolidations have taken place which results in the drastic increase in District Size and the reduction in the Number of Districts.
Change in Demographic over the Past 10 Years Student Free and Reduced Lunch Status by Year Student Race/Ethnicity Status by Year 2012-2013 2004-2005 2011-2012 2004-2005 2011-2012 2012-2013 • The % economically disadvantaged has increased a bit over the years. • The Racial Demographics also have not changed significantly over the years; compared to other states, AR is not racially diverse.
Benchmark End-Of-Course Norm-Referenced Test NAEP Test Scores Measurement of Statewide Performance
Benchmark - Mathematics For all Regions, there have been a significant increase in performance between 2004-05 and 2011-12. However there has been a slight levelling-off effect between the years 2011-12 and 2012-13 in all regions.
Benchmark - Literacy The same applies for Literacy. Significant increase in performance between 2004-05 and 2011-12. However there has been a levelling between 2011-12 and 2012-13 in all regions.
End-Of-Course (EOC) Exam NB: There has not been a recorded Biology score in 2004-2005 academic year. The star highlights the Biology score for the year 2007-08. Math scores have leveled off; Biology and Literacy still growing a bit. students.
Norm-Referenced Test - Math The Northwest Region scored above statewide average in Math over the years. This is the only test where there have been drops.
Norm-Referenced Test - Reading There has been a decline in average Percentile Rank between 2004-05 and 2011-12. But the average has remained consistent in all regions between 2011-12 and 2012-13.
NAEP 4th Grade Math Performance Border States Arkansas has had a significant increase between 2000 and 2003 and continues to steadily increase since then.
NAEP 8th Grade Math Performance Arkansas has steadily increased but remains below the National Average
NAEP 4th Grade Reading Performance Arkansas’ performance has fluctuated over the years. However in 2005, AR “caught up” to the National Average, but have been below average since.
NAEP 8th Grade Reading Performance Arkansas’ performance has fluctuated over the years. Unfortunately it has not been able to meet the National Average.
Here, we examine achievement of racial sub groups Achievement of Important Student Sub Groups
A Look into Arkansas’ Performance in 2012-2013 • In both grade levels, the minority groups have relatively low math achievement. • Note that Arkansas’ Grade 4 Hispanic students are the only ones that surpass the National scores. • Reading students show a similar pattern.
Change In Math Performance from 2009 to 2013 Arkansas’ Black students moved from12% Proficient/ Advanced students in 2009 to 17% in 2013. Arkansas’ Hispanic students moved from26% Proficient/ Advanced students in 2009 to 31% in 2013 Arkansas’ Hispanic students showed the highest amount of increase in Grade 8 Math vs. the nation. The grew from 15% Proficient/ Advanced in 2009 to20% in 2013.
Change in Reading Performance between 2008-2009 and 2012-2013 With the exception of Arkansas’ Hispanic students, the state showed comparable increase in the number of Proficient/ Advanced students in Grade 8 Reading Arkansas’ Hispanic Students showed the most amount of increase in their performance vs the nation. They moved from 16% Proficient/ Advanced students in 2009 to 24% in 2013
Graduation Rates The Southwest region has the highest graduation rates though it consist of the Highest Minority Group Population in Arkansas.
Graduation Rates vs Test Scores This positive finding in Graduation Rate stands in contrast to lower than average performance on test scores.
Graduation Rates vs High School Demographics Note Southwest region has achieved the Highest Graduation Rate even while being challenged by the second highest % FRL … Perhaps there is a school size story here?
Thank You !!! • Any Question? Comments? • Email: • garyr@uark.edu • mlcrouch@uark.edu • Phone: (479) 575-3773 • Website: www.officeforeducationpolicy.org