Download
1 / 81
820 likes | 1.05k Views
Site Instrumentation Methods by Jim Richardson and Mike Vepraskas. Modified 9/08. Overview. Criteria for picking monitoring sites Selection of equipment and installation Data collection & interpretation Rainfall measurements. Selecting Sites to Monitor.

E N D
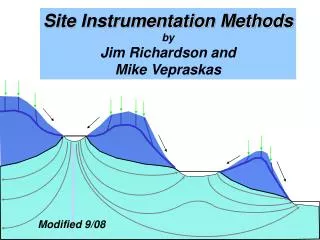
Site Instrumentation Methods by Jim Richardson and Mike Vepraskas Modified 9/08
Overview • Criteria for picking monitoring sites • Selection of equipment and installation • Data collection & interpretation • Rainfall measurements
Selecting Sites to Monitor • Pick sites that are representative of a large area--both in terms of landscape position and microtopography • Pick at least one site in an area known to be hydric, and one site in the upland (transect). • Replicate sites at the same landscape position (traverse).
Boundaries In many cases you want to monitor across boundaries between: • Wetland vs. Non-Wetland • Hydric vs. Non-Hydric Soils
Think Shallow • Hydric soils are saturated either on the surface or within 12 in. of the surface. • Do not focus too deeply • Be sure to monitor within 12 in. of surface
PIEZOMETER AND WELL NESTS TRAVERSE TRANSECT Upland (Not hydric) Hydric Boundary? Hydric
SOIL Microtopography should be similar at an installation 10 ft Piezometers or wells will give different readings
Where do you place your Instruments? Potential hydric soil zone
Where do you place your Instruments? Monitoring Sites Hydric soil boundary
Flood Plain Backplain flat Levee Backswamp Alluvium Till Where do you place your instruments?
Flooding Depth and Duration are Important too Flooded and ponded For long duration— Hydric soils Flooded for Short duration (not hydric?) Alluvium Till
Use Transects Across Hydric Boundaries Wells and piezometers Possible Boundaries
Soils Considerations • Complete a profile description for each plot where equipment will be installed. • Estimate the depth to any layers that may perch water for long periods, and any sand deposits. • From the description, estimate the depths that wells and piezometers will be installed.
Perched Water Table Piezometers Well Sand Clay Sand Shallow piezometer contains water, but lower piezometer does not. Perched water table detected. Water drains down well, Saturation undetected
Upland Boundary Hydric Soil Soil Descriptions Suggest Boundaries A Bw Bk Btg
Overview • Criteria for picking monitoring sites • Selection of equipment and installation • Data collection & interpretation • Rainfall measurements
Finding the Water Table • Wells should be used to identify water tables. • Piezometers measure pressure, and not the free water surface. • Wells work best when they don’t penetrate a layer that is perching water or intersect large cracks
Wells and Piezometers Wellsare tubes that contain many holes to let water in. Piezometers contain few holes, and let water in mainly at their bottom. Wells show the depth to the water table Piezometers show if soil around holes is saturated
Piezometers vs. Wells • We suggest placing one well at each site whenever you need to know where the water table is. • Piezometers should be used to conform to the technical standard (one in the upper 10 in.) • Do not use wells in Vertisols or any other clayey soil where bypass (crack) flow can occur
Vertisols have large, continuous cracks that carry water deep into the soil when soil is dry Water flow Wells have many holes, and some holes will be next to cracks Dry Ped Water in well is from “Crack Flow”. Soil is not saturated Dry PED
AQUIFERSCONFINED & UNCONFINED Unconfined Aquifer- in soil SATURATED ZONE Confining aquitard (clay) Confined aquifer- sand
“Domed” Organic Soil Piezometer Muck Sand Clay Sand 0 Mucky Mineral -75 Sand -169 -170
“Domed” Organic Soil forms over point of upwelling water? Muck Break in clay allows water through Sand Clay Sand 0 Surface Organic Mucky Mineral -75 Sand -169 -170
Dismal Swamp Scarp
Suffolk Scarp Stream Sandy loam Clay confining layer Saturated Sand (confined aquifer)
Stream has cut through Confining layer. Water from confined sand flows into channel.
Thick organic deposits form on plain. Dismal Swamp
Stratified Soil with Confined Aquifer Where do you place your piezometers? A-horizon (Loam) SUGGESTION: Place wells in surface aquifers down to confining layer. Place piezometers in confined aquifers. E-horizon (Loam) Bt-horizon (CLAY) C- LOESS (silt) Btb-PALEOSOL (CLAY)
slots Ideal: Piezometers In permeable layers Avoid: Piez. Will not fill in clays Well A-(Loam E-(Loam) Bt (CLAY) C- LOESS Btb-PALEOSOL (CLAY)
Recharge - EpiSATURATED or PERCHED A-(Loam E-(Loam) Bt (CLAY) Water levels C- LOESS Btb-PALEOSOL (CLAY)
Discharge - EndoSATURATED A-(Loam Water levels E-(Loam) Water in loess Under pressure: Artesion Condition Bt (CLAY) C- LOESS Btb-PALEOSOL (CLAY)
Backfill with soil, packed well Surface Cone Soil or bentonite + soil (2:1) mix for sandy soils. Carefully packed. Check every visit. Bentonite Seal 3 to 6 inches Sand Pack ~ 3” above slots 6” of Well Screen or slots 3+” Loose Cap: use Pop (soda) can Basic Piezometer Installation Method Drill air hole In tube if cap Is tight
Surface Cone Soil or bentonite + soil (2:1) mix for sandy soils. Carefully packed. Check every visit. Backfill with soil, packed well Bentonite Seal 3 to 6 inches Sand Pack Well Screen or slots over depth of interest 3+” Loose Cap: use Pop (soda) can Basic Well Installation Method Drill air hole In tube if cap Is tight
Fabric Covers or Socks for Wells and Piezometers Cover holes With porous fabric. Tape Sand and Soil may fall into holes in Wells and Piezometers. • Can use” • Geotextile, • Drain Sock, • Women’s nylons Knot at bottom
For Flooded Sites Use a Surface Marker Along with wells and piezometers Gauge showing water height above surface
Steel rod Cork Float High Water Table Indicator Stolt, Univ. Rhode Island Well pipe cut in half To see inside Magnet
Another Type of Well Recorder This is Circular 1409, http://edis.ifas.ufl.edu/CH151. B. J. Boman, and T. A. Obreza, Cooperative Extension Service, University of Florida Gainesville, FL 32611.
Overview • Criteria for picking monitoring sites • Selection of equipment and installation • Data collection & interpretation • Rainfall measurements
Time to Make Readings • Collect data weekly during a critical time of year when water levels are “high” (usually winter, spring, and fall). • Monthly readings may be adequate when water levels are low (e.g. in summer).
Jan. July Dec Typical Wetland Hydrograph Winter Peak Summer ET ponded Surface Saturated < 30cm Water Table Depth (cm) -30cm Spring Falling Limb Fall Rising Limb Time (Months)
How often do you make measurements? • Measure at least weekly • Daily measurements are needed for some modeling work • If you use automated systems, set for daily measurements, and visit monthly.
Water levels in piezometers differ with depth in recharge and discharge areas Recharge Discharge
Piezometer Readings • Data must be plotted separately for each piezometer. • Note when free water present at depth of slotted portion of tube. • Can plot depth of water or plot “saturated”or “not saturated” as a bar over time.
Finding the Water Table with Piezometers Where is the water table in this soil? 2 ft. Piezometers 6 ft.
If you must use a piezometer to identify a water table,then use the water level in the shallowest piezometer for your estimate Water table 2 ft. 6 ft.
Water Table Fluctuations during rain events • In some soils, water tables move up and down quickly during and after a rain. • In other soils, there is much less fluctuation. • The amount the water table rises during a rain is related to the soils drainable porosity.