Enhancing Multivariate Data Visualization: Strategies, Technologies, and User Interactivity
This document outlines advanced strategies for multivariate data visualization, focusing on improving accessibility, interactivity, and user engagement in data analysis. It emphasizes the need for layered representations, effective reading orders, and interactive spaces allowing users to manipulate data points seamlessly. The design considerations highlight the importance of using modern web standards, including HTML5 and SVG, to enhance performance and interactivity. Additionally, it discusses collaborative data analysis features, enabling users to record, save, and share dynamic visualizations and scripts within an interactive portal.

Enhancing Multivariate Data Visualization: Strategies, Technologies, and User Interactivity
E N D
Presentation Transcript
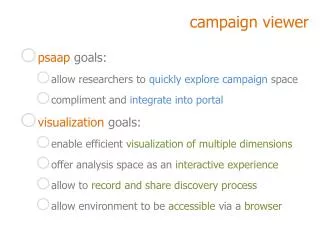
campaign viewer • psaapgoals: • allow researchers to quickly explore campaign space • compliment and integrate into portal • visualization goals: • enable efficient visualization of multiple dimensions • offer analysis space as an interactive experience • allow to record and share discovery process • allow environment to be accessible via a browser
STRATEGIES FORmultivariate visualization LIMITATIONS • limited visual space • limited visual comprehension DESIGN CONSIDERATIONS • complex data better understoodlayered representation • reading order (levels of importance) • i.e. emphasizing/de-emphasizing different components of representation • data discretized/binned • offer >6 visual dimensions • create interactive/intuitive space
interactivity considerations • allow direct interaction • make objects (variables/dimensions) draggable • make rendered datapoints interactive • allow efficient interaction • easy navigation of variable-dimension coupling • via keystrokes • via clicking • via dragging
browser considerations • use new standards/technologies • html5 • drag/drop • canvas (vs embedded svg) • use standard client/server communication api • XMLHttpRequest • xml formatted data collections • xml formatted data • xml formatted scripts
canvas vssvg • canvas • + html element with direct js access • +currently faster/more stable (under chosen browsers) • - generates pixel represention • - interativity needs to be added separately • svg • - requires connections to html document (and back) • + generates vector based representation • + interactivity can be encoded in visual elements • + xml format
scripting considerations • allow to record interactive session • allow edit scripts • allow to save/share/publish • scripts can be stepped through • with same or different data • keep data/environment interactive along replay • make scripting/replay seamless
portal integration • enable collaborative data analysis • plots+scriptingas part of sharable information • leading into web based collaborative dashboard • dashboard= information summary suggested actions • sample, see IBM’s Dashiki/ManyEyeswikified • data grouping • definition of batch-jobs/campaigns (custom subsets) • allows for targeted/better defined data analysis
application backend • goal: allow for easy access to data, optimized for grouping • object-oriented approach to group creation • strong representation of each simulation • Djangoimplementation • Python based classes • creation of classes to represent simulations, targets, projectiles,.. • + flexibility allows for modified/new model paradigms • enables manipulation from pre-existing python code and libraries • still in development stage
application backend: django • implementation using jinja2 template language • increased freedom in template design • + extends django templates with custom method calls • .i.e. passing of arbitrary arguments to functions • developed with the django-command-extensions • easy database-insensitive backup • exports the database using django’sapi • i.e. programmatically adds entries to the database using python • + other added features • e.g. automated way to graphically represent database backend
current development • developed using new html5 standards • developed in Safari • some testing on portable device (iPad) • some testing on Mozilla based browsers • implemented basic interactivity • drag/drop • keystroke navigation • script recording/playback • dynamic loading