Download
1 / 5
50 likes | 174 Views
This study utilizes the "Ishmael" software to analyze right and humpback whale calls through spectrogram correlation with synthetic calls. It explores various parameters of these synthetic calls and compares detector performance to a human analyst. The findings reveal critical patterns in right whale calling behavior, including seasonal occurrence and time of day variations. Notably, right whale calls peaked during the summer months and were primarily detected at night. This research sheds light on the occurrence and vocalization patterns of right whales in the Southeast Bering Sea.

E N D
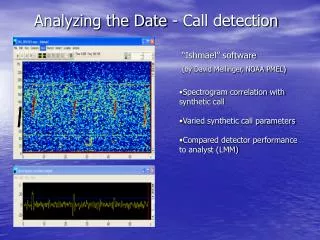
Analyzing the Date - Call detection “Ishmael” software (by David Mellinger, NOAA PMEL) • Spectrogram correlation with synthetic call • Varied synthetic call parameters • Compared detector performance to analyst (LMM)
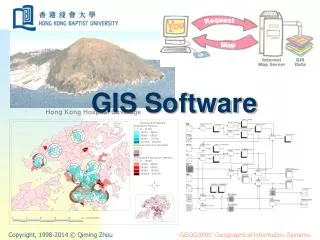
200 160 120 80 40 200 160 120 80 40 Frequency (Hz) Spectrum level (dB re counts2/Hz) 0 40 80 120 Time (s) 0 40 80 120 Time (s) Right whale and humpback calls Right whale calls: ‘Up-call’ most common (> 80%) Clustered into bouts Humpback whale calls: May appear similar to RW calls Patterned, repeated phrases
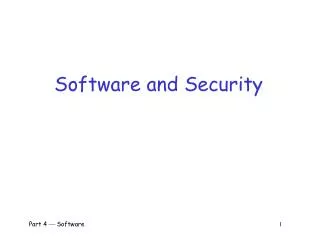
Results Right whale seasonal occurrence SEBS middle-shelf • Earliest yearly right whale detections in late May (2002, 2004) • Latest in mid-December (2005) • Highest calling rates in Aug., Sep. (2001, 2004, 2005) & Dec. (2005) • Longest calling durations in Aug., Sep., Oct. • Calling usually lasted 2-3 consecutive days, up to 6 d • Intervals between calls 2-49 d (median = 7) 2000-2005 Right whale calls/day J F M A M J J A S O N D
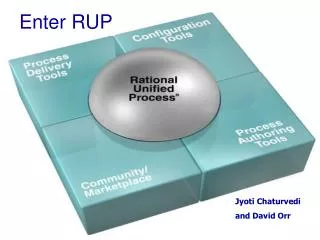
75% Median Mean 25% * Daily Calling Patterns • Hourly calling rates calculated for five periods of day • Adjusted by overall calling rate for that day • Calling rates were highest during dark period
Conclusions • Right whale occurrence varied by season and between years • Calls were detected for only a few days at a time • Calling rates were highest at night • Right whales were in the Southeast Bering Sea as early as May and as late as December