Download
1 / 19
190 likes | 350 Views
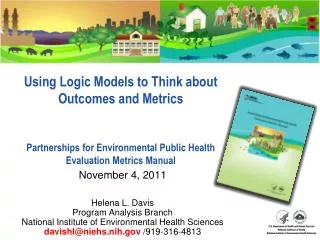
Using Logic Models to Think about Outcomes and Metrics Partnerships for Environmental Public Health Evaluation Metrics Manual. November 4, 2011 Helena L. Davis Program Analysis Branch National Institute of Environmental Health Sciences davishl@niehs.nih.gov /919-316-4813.

E N D
Using Logic Models to Think about Outcomes and MetricsPartnerships for Environmental Public Health Evaluation Metrics Manual November 4, 2011 Helena L. DavisProgram Analysis BranchNational Institute of Environmental Health Sciencesdavishl@niehs.nih.gov/919-316-4813
National Institute of Environmental Health Sciences • Mission: reduce the burden of human illness and disability by understanding how the environment influences the development and progression of human disease • The Division of Extramural Research and Training funds a broad portfolio of research across the country and abroad
Partnerships for Environmental Public Health (PEPH) • PEPH Program Objectives: • Prevent, reduce or eliminate environmental exposures that may lead to adverse health outcomes in communities • Increase the impact of environmental public health research at local, regional, and national levels • Partners include community members, scientists, educators, health care providers, public health officials, and policy makers • Participatory development • Request for Information, Winter 2007-8 • Workshop, June 2008
Why create a PEPH Evaluation Metrics Manual? • PEPH Stakeholders identified evaluation metrics as a clear need: • RFI & Workshop, 2008 • Results not published in peer reviewed biomedical journals • Helpful to establish a common language around activities, outputs, and impacts among those involved in PEPH projects • www.niehs.nih.gov/pephmetrics
Priority PEPH Program Activity Areas (for metrics) • Introduction • Partnerships • Leveraging • Products and dissemination • Education and training • Capacity Building • Evaluation Partnerships Communication Capacity Building
Chapter Structure • Example Logic Model • For each “box” in the model (activity, output and impact): • Description/definition of the term/concept • Approaches for implementing the tasks and collecting evaluation data • Example metrics • PEPH Project Examples • Summary table of all metrics in Chapter Other key features of the document • Additional Evaluation Resources found in Appendix 4 • List of all examples found in Appendix 6
Example Logic Model Process Measures Actions that use available inputs to “do” something Direct products of activities Outcome Measures Benefits or changes resulting from the activities and outputs Not prescriptive “Maturity” increases to the right
Activity 4: Build knowledge and skills Metrics might include • Number of classes, workshops and other training offered/attended • Evidence of new skills • Number of papers published in non-academic outlets
Community University Partnership in New Orleans • Deep South Center for EJ and United Steelworkers • Provide opportunities for communities, scientific researchers, and decision makers to collaborate on programs and projects • Promote the rights of all people to be free from environmental harm as it impacts health, jobs, housing, education, and general quality of life.
Safe Way Back Home Project • Trained residents of New Orleans who were displaced after Hurricane Katrina • Community members learned to remove contaminated soil, pressure washed sidewalks, and revitalized landscapes Metrics • Provided 40 hours of Hazmat and Heath and Safety training • 650 people trained from 2006-2009 • Remediated more than 60 lawns and 2 schoolyards
Example Metrics Include Community org: Research org: Funding Breadth of grant types and topic areas Community advisory board established and functional Involvement of CAB in research project development • Financially solvent • Governance rules exist and are followed • Number of members in the community organization • Descriptions of physical buildings and equipment available to the community organization
Output 2 Example: Concerned Citizens of Tillery • Community-based organization, founded 1978 • Promotes social justice and self-determination for rural African American communities • Promotes and improve the social, economic, and educational welfare of the citizens of Tillery and eastern NC • Approach: self-development of its members • Major focus area: EH effects of hog farms
CCT and the NC Environmental Justice Network • Hosted 9th Annual Environmental Justice Summit in 2007: “Head ‘em Up - Move ’em Out: Landfills & Hogs” Metrics: • >125 community members, elected officials, researchers and students participated in scientific presentations, workshops, and plenary sessions • Quarterly meetings bring groups and individuals together from across NC • More than 250 people attend bringing the issues of environmental justice to the forefront of local newspapers • Expertise in hog farms led to partnerships, in turn led to stronger community base for both orgs
Impact 3: Changes in Environmental Health Policies and Regulation • Example Metrics Include • Descriptions of change in: • Institutional policy of legislation • Local Ordinances and/or zoning laws • Type of involvement by individuals • Frequency and number of individuals involved in changes
LA Unified School District Healthy Food, Healthy Schools Health Communities • Provided data on quality and costs of food to stakeholders • Parents used information to identify strategies to improve the food environment at the schools • Parents and other stakeholders worked with the school board to develop school lunch policies that brought fresh, healthy foods to the school • The project raised awareness of environmental public health issues and the research process among stakeholders
Collaborators Science and Technology Policy Institute National Institute of Environmental Health Sciences Beth AndersonSharon BeardChristina H. DrewCaroline H. DilworthLiam O’FallonKristi Pettibone Cara M. O’DonnellAshley T. BrennerSusanna HowiesonSarah J. RykerStephanie S. Shipp MDB Inc • Maureen Avakian Eric GuereroPatrick JonesMarisa Naujoukas GRANTEES!!!
Thank you! www.niehs.nih.gov/pephmetricsDraft copy on website; revised version will be ready by the end of November Helena L. DavisProgram Analysis BranchNational Institute of Environmental Health Sciencesdavishl@niehs.nih.gov/919-316-4813