Economic Thinking
210 likes | 234 Views
Learn about economics, marketing principles, and economic models in this comprehensive guide. Understand scarcity, productive resources, opportunity cost, and more. Discover how microeconomics and macroeconomics shape the economy and the policy tools used. Practice solving economic equations and interpreting graphs. Enhance your knowledge for strategic decision-making!

Economic Thinking
E N D
Presentation Transcript
Economic Thinking Macroeconomics What is Marketing? Principles of Marketing
What is Economics? Economics is the study of how humans make choices under conditions of scarcity Scarcity exists when human wants for goods and services exceed the available supply
Productive Resources • Land: any natural resource, including actual land, but also trees, plants, livestock, wind, sun, water • Economic capital: anything that’s manufactured in order to be used in the production of goods and services • Labor: any human service—physical or intellectual. Also referred to as human capital • Entrepreneurship: the ability to recognize a profit opportunity, organize the other factors of production, and accept risk
Opportunity Cost Opportunity cost is what we give up when we choose one thing over another.It is the value of the next best alternative
Division of Labor and Specialization • Division of labor: the work required to produce a good or service is separated into tasks performed by different workers • Specialization: when workers or firms focus on tasks for which they are well suited within the overall production process
Economies of Scale • Economies of scale exist when the average cost of producing each individual unit declines as total output increases • It is often most efficient to specialize and take advantage of economies of scale and then trade
What is Microeconomics? Microeconomics focuses on the actions of individual agents within the economy, like households, workers, and businesses
What is Macroeconomics? Macroeconomics studies the economy as a whole. It focuses on macroeconomic goals such as: • Growth in the standard of living • Low unemployment • Low inflation
Policy Tools • Monetary policy involves policies that affect bank lending, interest rates, and financial capital markets; it is conducted by a nation’s central bank such as the Federal Reserve • Fiscal policy involves government spending and taxes; it is determined by a nation’s legislative. For the United States, this is the Congress and the executive branch, which establishes the federal budget
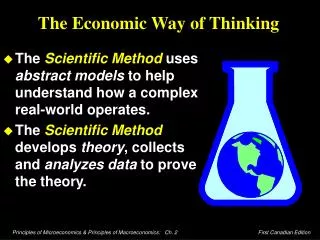
Economic Models An economic model is a simplified version of reality that allows us to observe, understand, and make predictions about economic behavior A good model is simple enough to be understood while complex enough to capture key information
Math Review Order of Operations: • Simplify inside parentheses and brackets • Simplify the exponent • Multiply and divide from left to right • Add and subtract from left to right y=mx + b is the equation for a line To solve an equation, isolate the variable
Types of Graphs: Line Graph Line graphs show a relationship between two variables: one measured on the horizontal axis and the other measured on the vertical axis.
Pie Graph A pie graph (sometimes called a pie chart) is used to show how an overall total is divided into parts. A circle represents the whole. The slices of this circular “pie” show the relative sizes of subgroups or subcategories
Bar Graph A bar graph uses the height of different bars to compare quantities
Practice Question Which type of graph would best show: • Growth in production over time? • A monthly household budget? • Number of publishing jobs in 25 cities? Pie Graph Bar Graph Line Graph
Slope A positive slopemeans that two variables are positively related—that is: • whenx increases, so does y, and • whenx decreases, ydecreases also Graphically, a positive slope means that as a line on the line graph moves from left to right, the line rises
Slope is rise divided by run Rise: Change in variable on vertical axis (end point minus original point) Run: Change in variable on horizontal axis (end point minus original point)
Quick Review • What is economics? • Define scarcity, opportunity cost, and specialization. • What are microeconomics and macroeconomics? • How do economists use models, graphs and mathematical equations?