Download
1 / 23

E N D
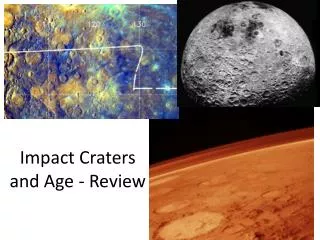
Craters Final Astronomy Lab
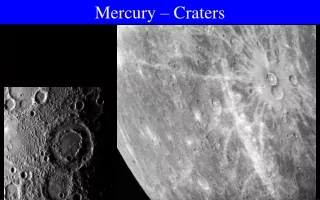
Lunar Crater Categorization • In 1978, Chuck Wood and Leif Andersson of the Lunar & Planetary Lab devised a system of categorization of lunar impact craters. They used a sampling of craters that were relatively unmodified by subsequent impacts, then grouped the results into five broad categories. These successfully accounted for about 99% of all lunar impact craters. http://www.unm.edu/~abqtom/images/Moon/Moon11-19-02b.jpg
The LPC Crater Types: • ALC — small, cup-shaped craters with a diameter of about 10 km or less, and no central floor. The archetype for this category is 'Albategnius C'. http://www.edwardroach.com/uploads/Albategnius_9-3-07_504edt_300frames.jpg
The LPC Crater Types: • BIO — similar to an ALC, but with small, flat floors. Typical diameter is about 15 km. The lunar crater archetype is Biot. http://www.astrospider.com/images/moon/Biot_LAC98map.jpg
The LPC Crater Types: • SOS — the interior floor is wide and flat, with no central peak. The inner walls are not terraced. The diameter is normally in the range of 15-25 km. The archetype is Sosigenes crater. http://history.nasa.gov/ap15fj/photos/o/as15-97-13288.jpg
The LPC Crater Types: • TRI — these complex craters are large enough so that their inner walls have slumped to the floor. They can range in size from 15-50 km in diameter. The archetype crater is Triesnecker. http://www.damianpeach.com/lunartemp/triesnecker02.jpg
The LPC Crater Types: • TYC — these are larger than 50 km, with terraced inner walls and relatively flat floors. They frequently have large central peak formations. Tycho crater is the archetype for this class. http://upload.wikimedia.org/wikipedia/commons/7/7e/Mooncrater.jpg
The LPC Crater Types: • Beyond a couple of hundred kilometers diameter, the central peak of the TYC class disappear and they are classed as basins. http://www.uwsp.edu/geo/projects/geoweb/participants/dutch/Sudbury/schrodinger.gif
Question • How do the variables of velocity, size, and meteor angle to surface affect the outcome of resultant craters? http://apod.nasa.gov/apod/image/0507/impact13sec_deepimpact_hri.jpg
Hypothesis • Develop a hypothesis about the outcome of your experiment based on your observations, reading, and experience http://www.photoaxe.com/wp-content/uploads/2007/02/droplet.jpg
Your Lab • You collected data on: • Speed of the impact (depending on height you dropped your clay ball) • Angle of impact (depending on how far back you were) • Size of meteor (depending on whether your clay was 1, 2 or 3 pieces) http://upload.wikimedia.org/wikipedia/en/c/c8/AS11-42-6285.jpg
Finish Collecting Data • Collect your data • Return all your equipment • If you have finished your collection, you may spend time with the resources http://crism.jhuapl.edu/education/downloads/GUIDE_Lesson2.pdf
Analyze Your Data • You collected 3 trials of a single variable, then collected 3 trials of the next variable, and so on. • Find the mean of each of your variables. • Add three trials and then divide by 3 1.2 1.3 1.1 3.6 1.2 0.8 1.0 0.9 2.8 0.9 3.0 2.4 3.1 8.5 2.83 1.9 2.3 1.7 5.9 1.96 1.8 1.7 2.1 5.7 1.9 4.2 4.1 4.8 13.1 4.36 3.2 3.8 3.9 10.9 3.63 2.3 2.8 2.8 7.9 2.33 5.2 5.2 8.2 18.6 6.2 4.5 4.3 4.1 12.8 4.26 3.4 3.1 3.1 9.6 3.2 6.0 5.8 6.2 18.0 6.0
Analyze Your Data • First, let’s look at how our data varies around the mean
Analyze Your Data • Next, let’s start picturing our data using averages • Does this make sense?
Analyze Your Data • How about this graph?
Analyze Your Data • Or this one.
Conclusions • What is your answer about the size, depth and ray length as the velocity increases? • If you have any unusual data, give an education guess what happened (most likely, human error)
Produce an 8½ x 11” or larger “poster” of this experiment Introduction: Background on craters (tell me how they are formed) List your citations Methods: Describe your experimental design (include your hypothesis) Results: Include both a table and graph of your data Discussion: Tell me what you learned For This Lab…