Bellwork 9/15/2014
120 likes | 140 Views
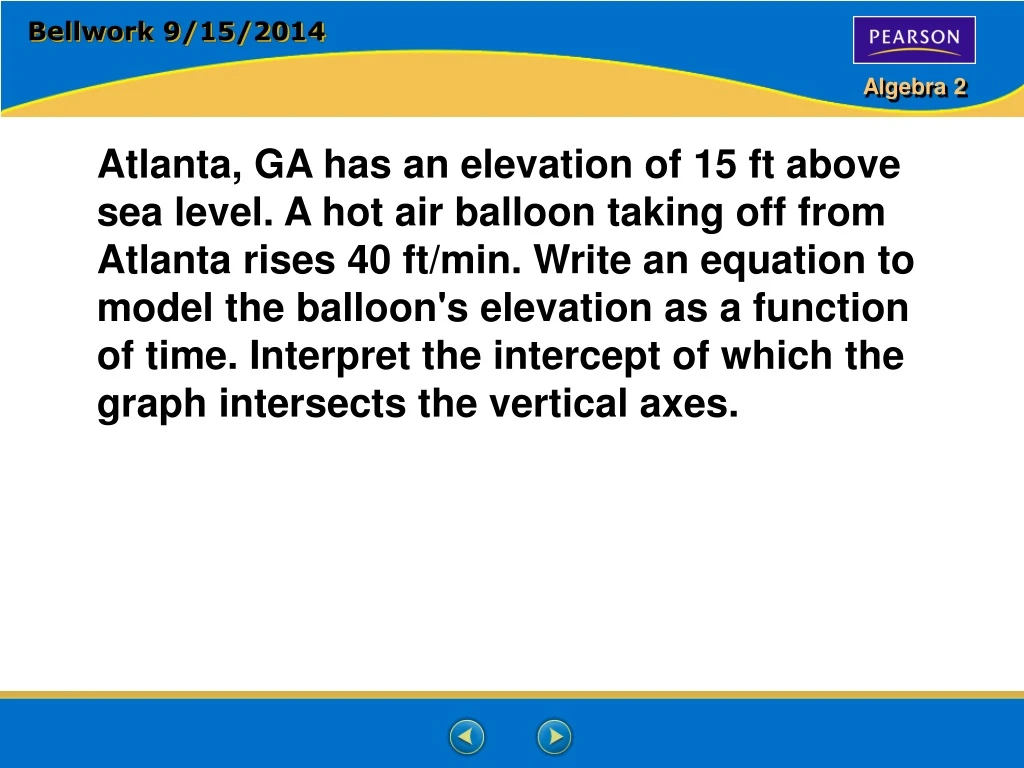
Bellwork 9/15/2014. Atlanta, GA has an elevation of 15 ft above sea level. A hot air balloon taking off from Atlanta rises 40 ft/min. Write an equation to model the balloon's elevation as a function of time. Interpret the intercept of which the graph intersects the vertical axes.

Bellwork 9/15/2014
E N D
Presentation Transcript
Bellwork 9/15/2014 Atlanta, GA has an elevation of 15 ft above sea level. A hot air balloon taking off from Atlanta rises 40 ft/min. Write an equation to model the balloon's elevation as a function of time. Interpret the intercept of which the graph intersects the vertical axes.
Relate:plane’s elevation = rate • time + starting elevation . Define:Let t = time (in minutes) since the plane began its descent. Let d = the plane’s elevation. Write:d = –300 • t + 8000 Using Linear Models Lesson 2-4 Additional Examples Suppose an airplane descends at a rate of 300 ft/min from an elevation of 8000 ft. Write and graph an equation to model the plane’s elevation as a function of the time it has been descending. Interpret the intercept at which the graph intersects the vertical axis.
Using Linear Models Lesson 2-4 Additional Examples (continued) An equation that models the plane’s elevation is d = –300t + 8000. The d-intercept is (0, 8000). This tells you that the elevation of the plane was 8000 ft at the moment it began its descent.
Using Linear Models Lesson 2-4 Additional Examples A spring has a length of 8 cm when a 20-g mass is hanging at the bottom end. Each additional gram stretches the spring another 0.15 cm. Write an equation for the length y of the spring as a function of the mass x of the attached weight. Graph the equation. Interpret the y-intercept. Step 1: Identify the slope. 0.15 or 3/20
Using Linear Models Lesson 2-4 Additional Examples (continued) Step 2: Use one of the points and the slope-intercept form to write an equation for the line. y = mx + b Use the slope-intercept form. 8 = 3/20(20) + b Substitute. 8 = 3 + b 5 = b y = 0.15x + 5 Solve for y.
Using Linear Models Lesson 2-4 Additional Examples (continued) An equation of the line that models the length of the spring is y = 0.15x + 5. The y-intercept is (0, 5). So, when no weight is attached to the spring, the length of the spring is 5 cm.
9.5 – 5 0.15 = xSolve for x. Using Linear Models Lesson 2-4 Additional Examples Use the equation from Additional Example 2. What mass would be needed to stretch the spring to a length of 9.5 cm? y = 0.15x + 5 Write the equation. 9.5 = 0.15x + 5 Substitute 9.5 for y. 30 = xSimplify. The mass should be 30 g.
Using Linear Models Scatter Plot: graph that relates two different sets of data by plotting the data as ordered pairs.
Using Linear Models B C A D E No Correlation Weak Positive Correlation Weak Negative Correlation Strong Positive Correlation Strong Negative Correlation
Using Linear Models Lesson 2-4 Additional Examples An art expert visited a gallery and jotted down her guesses for the selling price of five different paintings. Then, she checked the actual prices. The data points (guess, actual) show the results, where each number is in thousands of dollars. Graph the data points. Decide whether a linear model is reasonable. If so, draw a trend line and write its equation. {(12, 11), (7, 8.5), (10, 12), (5, 3.8), (9, 10)} A linear model seems reasonable since the points fall close to a line. Trend lines and equations may vary.
Using Linear Models Lesson 2-4 Additional Examples (continued) A linear model seems reasonable since the points fall close to a line. A possible trend line is the line through (6, 6) and (10.5, 11). Using these two points to write an equation in slope-intercept form gives y = x – . 10 9 2 3
Using Linear Models Homework Pg. 81 1-11 ALL