Download
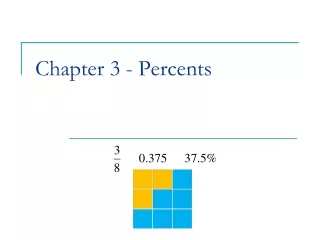
1 / 15
150 likes | 278 Views
The bar graph summarizes the responses of a number of dogs who were asked “What is your favorite food?” What percent said “cats”? A. 6% B. 17% C. 11% D. 30%. Part 3 Module 1 Calculations involving percents.

E N D
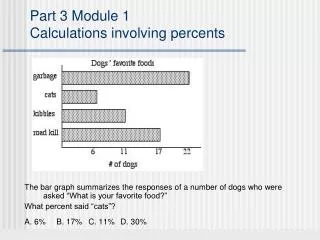
The bar graph summarizes the responses of a number of dogs who were asked “What is your favorite food?” What percent said “cats”? A. 6% B. 17% C. 11% D. 30% Part 3 Module 1Calculations involving percents
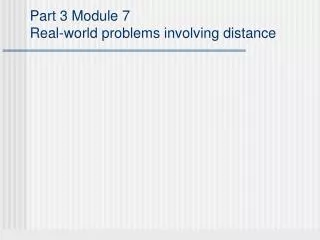
To calculate a percent, we start with a ratio or fraction, and then turn the fraction into a percent. In this case, we need to know the total population (N), and then number who gave “cats” as their response. The graph shows that 6 dogs said “cats,” 11 said “kibble,” 17 said “road kill,” and 22 said “garbage.” Calculating percents
The graph shows that 6 dogs said “cats,” 11 said “kibble,” 17 said “road kill,” and 22 said “garbage.” We use these numbers to get the total population, N. N = 6 + 11+ 17 + 22 = 56 Out of a total population of 56 dogs, the number who said “cats” was 6, so the proportion who said “cats” is 6 out of 56. 6/56 = .107 (rounded to three decimal places). To turn this decimal number into a percent, we “multiply by 100%,” which means that we move the decimal point two places to the right, and affix the percent sign. .107 = 10.7% In the multiple-choice problem, the answers were rounded. The best choice is C. 11% Calculating percents
If a quantity is increasing or decreasing over time, then to calculate the percent increase or percent decrease, again we start with a fraction, and then turn the fraction into a decimal number, and then into a percent. For this calculation, the baseline (the number in the denominator) is the beginning amount (that is, the quantity before the increase or decrease occurred). The number in the numerator is the amount of increase or decrease. Percent increase, percent decrease
In July, Gomer had 12 pet wolverines and 10 fingers. In August, he had 15 pet wolverines and 8 fingers. 1. Find the percent increase in his wolverines. A. 25% B. 125% C. 30% D. 3% 2. Find the percent decrease in his fingers. A. 80% B. 180% C. 20% D. 120% Percent increase, percent decrease
In July, Gomer had 12 pet wolverines and 10 fingers. In August, he had 15 pet wolverines and 8 fingers. Find the percent increase in his wolverines. For wolverines, the beginning amount is 12, and the amount of increase is 3, so the percent increase is 3/12 = .25 = 25% Find the percent decrease in his fingers. For fingers, the beginning amount is 10, and the amount of decrease is 2, so the percent decrease is 2/10 = .2 = 20% Percent increase, percent decrease
Question: What is a Procrustean Bed? A. An unreasonable standard... B. A subterranean geological formation... C. A spawning site for crabs and crayfish... D. I have no #@#%&! clue. A Procrustean Bed
A Procrustean bed is an arbitrary standard to which exact conformity is forced. The term is derived from the mythological story of the villain Procrustes, who would force unsuspecting victims to exactly fit his allegedly magical bed, by either stretching them on a rack if they were shorter than the length of the bed, or hacking off their legs if they were longer than the length of the bed. The term Procrustean bed is also used to denote a clumsy, inelegant approach to problem solving, wherein we try to change a problem so that it fits our preconceived solution. www.math.fsu.edu/~wooland/Stats3/cents12.html Before Andy spent the night at Procrustes' inn, Andy was 5 feet, 6 inches tall. The next morning, Andy was 6 feet, 4 inches tall. Find the percent increase in height. A. 0.25% B. 17.86% C. 15.15% D. 13.16% A Procrustean Bed
Before Andy spent the night at Procrustes' inn, Andy was 5 feet, 6 inches tall. The next morning, Andy was 6 feet, 4 inches tall. Find the percent increase in height. Since 5 feet = 60 inches, his beginning height of 5 feet, 6 inches is the same as 60 inches + 6 inches, or 66 inches. Since 6 feet = 72 inches, his ending height was 72 inches + 4 inches, which is 76 inches. Thus, the increase in height is 10 inches (76 – 66 = 10). Percent increase in height = (increase in height)/(beginning height) = 10/66 =.1515 = 15.15% A Procrustean Bed
Question: Suppose your percentile rank on the SAT verbal was 85. What does that score mean? A. 85% of people who took the test got higher scores than you. B. You answered 85% of the questions correctly. C. 85% of people who took the test got lower scores than you. D You answered 85% of the questions incorrectly. E. All of the above. Percentile Rank
Percentile rank is related to percent, but not quite the same. The percentile rank of a score in a distribution tells the percent of scores that were less than that score. For example, if the percentile rank of your score on the SAT verbal was 85, it means that you did better than 85% of the people who took the test. Percentile Rank
The percentile rank of a score in a distribution tells the percent of scores that were less than that score. A “score” in this context can be any quantity that can be sampled from a population or group. If, among the population of adult males, the percentile rank of Gomer’s body weight is 53, it means that 53% of adult males weigh less than Gomer. Percentile Rank
In this course, any question involving percentile rank will be very simple, requiring no calculation at all. The question will just test whether you know the definition of percentile rank. Many people will answer incorrectly, because they don’t understand the definition: The percentile rank of a score in a distribution tells the percent of scores that were less than that score. www.math.fsu.edu/~wooland/Stats2/percentilator5.html Percentile Rank
The table below shows the percentile distribution of scores on the final exam in the course Basic College Organ Transplantation. What percent of students had scores less than 52? score Percentile Rank 95 99 78 85 64 73 52 63 43 54 35 46 29 40 A. 9% B. 63% C. 54% D. 14% Percentile Rank
What percent of students had scores less than 52? The percentile rank of a score is the percent of the population who achieved less than that score. The table shows that a score of 52 has a percentile rank of 63. This means that 63% of the students had scores that were less than 52. The correct choice is B. score Percentile Rank 95 99 78 85 64 73 52 63 43 54 35 46 29 40 A. 9% B. 63% C. 54% D. 14% Solution