Download
1 / 2
20 likes | 167 Views
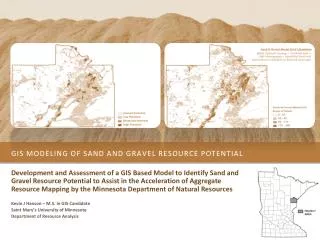
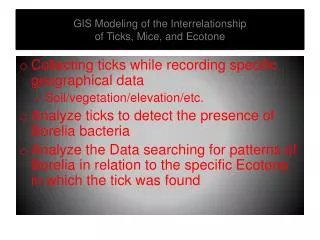
GIS Modeling of the Interrelationship of Ticks, Mice, and Ecotone. Collecting ticks while recording specific geographical data Soil/vegetation/elevation/etc. Analyze ticks to detect the presence of Borelia bacteria

E N D
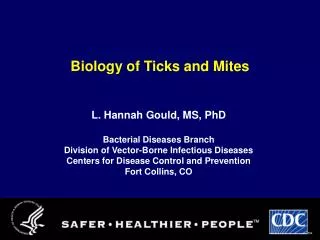
GIS Modeling of the Interrelationshipof Ticks, Mice, and Ecotone • Collecting ticks while recording specific geographical data • Soil/vegetation/elevation/etc. • Analyze ticks to detect the presence of Borelia bacteria • Analyze the Data searching for patterns of Borelia in relation to the specific Ecotone in which the tick was found
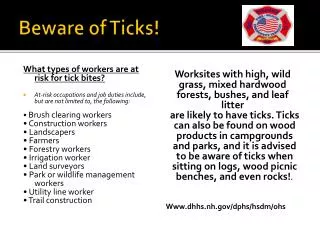
Possible Outcomes • Lyme's disease occurrences have been on the rise in the US partially due to climate change and expansion in tick population, but also due to increased human/tick interaction in fringe areas near cities. By identifying specific ecotomes required for the complex life cycles of ticks and Borrelia, we can possibly eliminate some of those factors in these fringe areas possibly reducing the incidence of disease being transferred to humans